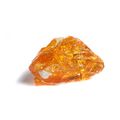
Natural Rubber

Natural Rubber

FAO Code: 0836 - Natural rubber in primary forms
Market:
Top Producer
2022
TH flagThailand
Production Volume
2022
25.23BKG
1Y +0.29%

Unlock the full potential of Tridge's Data with our Premium Access.

Elevate Your Competitive Analysis
Enhanced Data Portability & Detail
Exclusive Access for Informed Decisions
Already subscribed?

Production of Natural Rubber

Discover production data of Natural Rubber. Get production volume, price data, trends, and more. The information below is based on the FAO code 0836 (Natural rubber in primary forms).

Production Trends Overview of Top 10 Countries

See the production trends of the top 10 countries that have the highest production volumes.
TH flagThailand
Rank 1
4.8B kg
1y
-1.36%
3y
-0.29%
5y
+7.17%
ID flagIndonesia
Rank 2
3.1B kg
1y
+2.95%
3y
-9.09%
5y
-14.81%
VN flagVietnam
Rank 3
1.3B kg
1y
+5.31%
3y
+13.28%
5y
+22.39%
CI flagIvory Coast
Rank 4
1.3B kg
1y
+16.87%
3y
+64.86%
5y
+121.72%
CN flagChina
Rank 5
843.0M kg
1y
+12.55%
3y
+0.37%
5y
+3.14%
IN flagIndia
Rank 5
843.0M kg
1y
+12.55%
3y
+20.09%
5y
+18.23%
PH flagPhilippines
Rank 6
415.7M kg
1y
-3.46%
3y
-3.69%
5y
+2.15%
KH flagCambodia
Rank 7
394.7M kg
1y
+5.45%
3y
+37.22%
5y
+104.19%
MY flagMalaysia
Rank 8
377.0M kg
1y
-19.72%
3y
-41.07%
5y
-49.06%
MM flagMyanmar [Burma]
Rank 9
299.6M kg
1y
+6.32%
3y
+13.08%
5y
+25.87%

Trends of Top 10 Producers

This is the production trends of the top 10 producers of Natural Rubber from 2008 to 2022.
CountryProduction %Production Volume
200820092010201120122013201420152016201720182019202020212022
1Global18.72B18.77B19.83B21.36B23.12B23.69B23.28B23.19B23.57B25.30B26.02B26.28B25.33B25.15B25.23B
2Thailand31.91%3.17B3.09B3.05B3.35B4.14B4.31B4.57B4.47B4.52B4.50B4.81B4.84B4.86B4.89B4.83B
3Indonesia20.73%2.75B2.44B2.73B2.99B3.01B3.11B3.15B3.15B3.31B3.68B3.63B3.45B3.04B3.05B3.14B
4Vietnam8.86%660.00M711.30M751.70M789.64M877.11M946.87M961.10M1.01B1.04B1.09B1.14B1.18B1.23B1.27B1.34B
5Ivory Coast8.5%203.00M209.52M235.05M238.72M256.61M289.56M316.14M350.00M453.00M580.00M624.14M780.05M936.06M1.10B1.29B
6China5.57%547.86M618.87M690.81M750.85M802.26M864.81M840.17M816.10M815.94M817.37M824.09M839.91M687.60M749.00M843.00M
7India5.57%864.50M831.40M862.00M800.00M900.00M900.00M940.00M944.50M950.60M713.00M660.00M702.00M687.60M749.00M843.00M
8Philippines2.75%411.04M390.96M395.24M425.70M443.00M444.82M453.05M398.14M362.63M406.98M423.37M431.67M422.41M430.64M415.75M
9Cambodia2.61%31.68M37.38M42.25M51.34M64.53M85.20M97.10M126.80M145.20M193.30M220.10M287.64M358.70M374.30M394.70M
10Malaysia2.49%1.07B857.29M939.24M996.34M923.02M826.42M668.61M722.12M673.51M740.14M603.33M639.83M514.70M469.67M377.05M

Shares of Top 10 Producers

These are shares of top 10 producers of Natural Rubber in 2022.
Rank
Country
Country
2022
Production Quantity
2022
1-Year Growth in Qty
2021-2022
3-Year Growth in Qty
2019-2022
5-Year Growth in Qty
2017-2022
By clicking “Accept Cookies,” I agree to provide cookies for statistical and personalized preference purposes. To learn more about our cookies, please read our Privacy Policy.