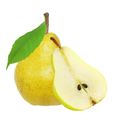
Discover production data of 신선 배 in 이스라엘. Get production volume, price data, trends, and more. The information below is based on the FAO code 0521 (Pears).
Related Market Brief Curations
Discover curated market data on production for 신선 배 in 이스라엘.
This is the production trends of 신선 배 in 이스라엘 from 2009 to 2023 in volume.
30.0M kg
1y
+7.14%
3y
+25.00%
5y
+15.38%
Production Volume and Price
Explore the production volume and price of 신선 배 in 이스라엘 from 2009 to 2023.
Type
Unit
2009
2010
2011
2012
2013
2014
2015
2016
2017
2018
2019
2020
2021
2022
2023
Quantity
KG
29.13M
30.94M
26.55M
28.00M
28.00M
23.69M
26.50M
27.00M
28.00M
26.00M
23.50M
24.00M
24.70M
28.00M
30.00M
Farmgate Price
USD / Metric Ton
1.60K
1.58K
1.69K
1.30K
1.56K
1.95K
1.64K
1.62K
1.88K
2.29K
1.92K
1.95K
2.49K
2.11K
1.82K
Who we are
Intelligence that moves markets. Connections that power trade.
From AI-powered intelligence to a global trade network, we help you make smarter decisions, optimize costs, and connect with the right partners—faster and easier.
By clicking “Accept Cookies,” I agree to provide cookies for statistical and personalized preference purposes. To learn more about our cookies, please read our Privacy Policy.