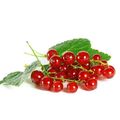
커런트
HS Code: 081120 - Fruit, edible; raspberries, blackberries, mulberries, loganberries, black, white or red currants and gooseberries, uncooked or cooked, whether or not containing added sugar or other sweetening matter
|
FAO Code: 0550 - Currants시장:
수출 점유율
2023
3.64%Rank 9
수입 점유율
2023
11.88%Rank 2
수출량
2023
9.05MKG
1Y +15.18%
수입량
2023
41.46MKG
1Y -23.88%
미국의 커런트 수출
미국의 커런트 수출 데이터를 살펴보고 수출액, 수출량, 가격 데이터, 동향 등을 확인해 보세요. 아래 정보는 HS 코드 081120 (Fruit, edible; raspberries, blackberries, mulberries, loganberries, black, white or red currants and gooseberries, uncooked or cooked, whether or not containing added sugar or other sweetening matter)를 근거하여 작성되었습니다.
수출 개요
2023년, 미국발 커런트 수출액은 미화 44.46M였으며, 총 수출량은 9.05K톤이었습니다.
2024년도 주요 수출 거래
미국발 커런트의 주요 수출 거래를 확인하세요.
미국발 커런트 수출 전체 데이터를 잠금 해제하세요.
수출 관련 주요 데이터를 기반으로 더 정확한 결정을 내려보세요. 가격, 업체, 시장 정보까지 모두 확인 가능합니다.
수출 대상국 점유율
2023년 미국발 커런트의 수출 대상국 비중을 확인하세요.
미국발 커런트의 주요 수입국으로는 캐나다, 멕시코, 칠레, 일본, 호주, 대한민국, 트리니다드토바고, 파나마, 도미니카공화국 등이 포함됩니다.
그 중에서 캐나다는 가장 큰 수입국으로, 전체 미국발 커런트 수출액 중 68.12%를 차지했습니다.
관련 정보
커런트을/를 본 사람들이 함께 본 상품
다른 과일 상품
'쿠키 허용'을 클릭하면 통계 및 개인 선호도 산출을 위한 쿠키 제공에 동의하게 됩니다.
개인정보 보호정책에서 쿠키에 대한 자세한 내용을 확인할 수 있습니다.