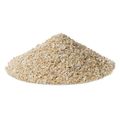
Rye Bran

Rye Bran

HS Code: 230240 - Bran, sharps and other residues; of other cereals, whether or not in the form of pellets, derived from the sifting, milling or other workings thereof
Market:
Top Exporter
2023
DE flagGermany
Top Importer
2023
TR flagTurkiye
Export Value
2023
139.72MUSD
1Y -63.07%
Import Value
2023
99.47MUSD
1Y -76.66%

Import of Rye Bran

Discover import data of Rye Bran. Get import value, price data, trends, and more. The information below is based on the HS code 230240 (Bran, sharps and other residues; of other cereals, whether or not in the form of pellets, derived from the sifting, milling or other workings thereof).

Import Trends Overview of Top 10 Importers

See the import trends of top 10 countries that have the highest import values.
TR flagTurkiye
Rank 1
$22.3M
1y
-27.89%
3y
+12.06%
5y
+12.88%
DE flagGermany
Rank 2
$19.8M
1y
-2.60%
3y
+17.18%
5y
+68.18%
CA flagCanada
Rank 3
$8.2M
1y
-3.66%
3y
+17.52%
5y
+18.11%
US flagUnited States
Rank 4
$7.8M
1y
-47.57%
3y
-46.62%
5y
-65.27%
UY flagUruguay
Rank 5
$7.2M
1y
+53.37%
3y
+84.16%
5y
+152.20%
MX flagMexico
Rank 6
$5.5M
1y
+76.64%
3y
+1.03%
5y
-28.27%
NL flagNetherlands
Rank 7
$5.4M
1y
+26.95%
3y
+7.90%
5y
-38.90%
DK flagDenmark
Rank 8
$3.7M
1y
+3.95%
3y
+136.46%
5y
+304.02%
IL flagIsrael
Rank 9
$2.9M
1y
+340.47%
3y
+107.67%
5y
+719.44%
GB flagUnited Kingdom
Rank 10
$2.6M
1y
+16.02%
3y
+57.26%
5y
+77.75%

Trends of Top 10 Importers

This is the import trends of the top 10 importers of Rye Bran from 2016 to 2023.
Country
Import %
Import Value
21/05
21/06
21/07
21/08
21/09
21/10
21/11
21/12
22/01
22/02
22/03
22/04
22/05
22/06
22/07
22/08
22/09
22/10
22/11
22/12
23/01
23/02
23/03
23/04
23/05
23/06
23/07
23/08
23/09
23/10
23/11
23/12
1Global$48.71M$37.76M$35.92M$37.09M$32.56M$27.40M$33.83M$36.30M$49.21M$32.22M$55.12M$38.46M$44.61M$42.97M$35.14M$25.70M$20.13M$19.47M$17.87M$24.58M$23.29M$20.32M$31.48M$33.67M$34.92M$36.68M$23.31M$31.57M$19.98M$11.86M$10.68M$6.45M
2Turkiye22.45%$3.68M$416.73K$3.19M$982.87K$492.08K$903.48K$1.81M$1.66M$4.08M$1.84M$3.50M$2.11M$4.79M$4.23M$2.88M$508.59K$2.45M-$2.41M$2.16M$2.85M$1.49M$2.54M$2.93M$2.43M$3.49M$2.27M$985.16K$490.60K$685.57K-$166.61K
3Germany19.89%$1.69M$2.76M$2.31M$2.16M$1.50M$1.89M$1.61M$1.82M$1.54M$2.30M$1.20M$1.68M$1.68M$1.72M$1.56M$1.52M$1.48M$2.14M$1.02M$2.59M$1.51M$2.06M$1.55M$2.32M$1.81M$2.49M$783.67K$1.63M$1.77M$1.65M$770.89K$1.42M
4Canada8.27%$851.72K$547.49K$716.65K$722.38K$1.89M$874.27K$605.44K$693.79K$713.73K$636.52K$1.06M$643.55K$662.52K$852.59K$800.75K$532.49K$772.31K$499.29K$721.02K$662.45K$564.76K$652.89K$823.20K$786.27K$674.00K$621.85K$684.63K$446.89K$834.86K$783.71K$691.62K$658.71K
5United States7.87%$863.75K$687.42K$1.10M$1.22M$1.39M$1.83M$899.23K$1.41M$669.60K$1.35M$1.66M$1.15M$2.11M$1.94M$1.10M$1.65M$963.95K$963.10K$706.10K$662.76K$698.50K$579.76K$898.36K$793.52K$723.32K$506.58K$583.46K$499.15K$682.09K$603.66K$601.13K$662.31K
6Uruguay7.28%$261.46K$576.24K$187.37K$244.60K$425.65K$183.80K$351.89K$76.34K$226.83K$311.86K$456.71K$318.65K$433.68K$236.26K$736.14K$308.63K$349.52K$263.83K$575.93K$506.58K$322.94K$986.28K$1.22M$1.11M$1.13M$797.14K$367.21K$525.98K$309.81K$97.07K$279.33K$109.04K
7Mexico5.49%$578.75K$610.55K-$566.18K-$816.60K$764.95K$776.51K--$826.02K--$927.16K-$693.81K-$643.34K--$912.52K-$1.10M$934.43K$984.27K$1.00M----$527.75K-
8Netherlands5.44%$350.51K$253.89K$252.90K$215.03K$281.20K$329.53K$286.68K$256.15K$304.05K$274.82K$367.33K$324.50K$283.89K$559.02K$257.01K$420.48K$287.09K$211.06K$439.81K$371.20K$361.70K$509.50K$354.05K$396.17K$512.16K$544.38K$357.75K$489.14K$341.56K$720.51K$531.80K$281.00K
9Denmark3.69%$130.52K$75.58K$83.76K$79.42K$135.02K$78.04K$90.25K$102.84K$179.05K$249.65K$456.93K$306.84K$188.98K$278.34K$183.11K$187.15K$750.21K$310.81K$257.85K$170.29K$230.14K$274.27K$399.52K$197.42K$301.29K$677.31K$160.73K$239.52K$233.56K$744.59K$149.26K$132.28K
10Israel2.89%$2.00K$6.00K$2.00K$25.00K$1.00K$3.00K-$33.00K$6.00K$26.00K-$29.00K$1.00K$13.00K-$20.00K$88.00K$260.00K--$86.00K$349.00K$465.00K$197.00K$238.00K$151.00K$247.00K$243.00K$212.00K$388.00K$183.00K$360.00K

Share of Top Importing Countries

Discover the share of top 10 importing countries of Rye Bran in 2023.
EUROPE
ASIA
NORTH AMERICA
SOUTH AMERICA
OCEANIA
AFRICA
OTHERS

Are you sourcing for Rye Bran?

Discover Rye Bran premium suppliers on Tridge. Contact suppliers that you are interested in and start receiving offers. Learn more about finding suppliers.

Explore More Through Our Services

Our Solution

Data & Analytics

Access actionable agri-food data and gain a deep understanding of global market dynamics and trends to enhance your business efficiency.
Our Solution

Insights

Keep track of the latest events and issues happening around the world through our in-depth contents and curation of relevant news.
Our Solution

Find Suppliers

Connect and engage with thousands of credible agri-food suppliers worldwide. Browse through their products and connect with them in real-time.
Our Solution

Find Buyers

Discover reliable buyers looking for your products and establish long-term relationships. Respond to their RFQs with your quotes.
image
Who We Are

The leading global sourcing hub of food & agriculture

We provide solutions to help you not only understand the global market of food and agriculture, but also start importing products that you need right away.
By clicking “Accept Cookies,” I agree to provide cookies for statistical and personalized preference purposes. To learn more about our cookies, please read our Privacy Policy.