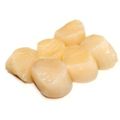
Global trading platform Tridge
Services
Resources
Company
Everything you love about a trade show, made 24/7
Sponsored by
image
Frozen Scallop

Frozen Scallop

HS Code: 030729 - Molluscs; scallops, whether in shell or not, including queen scallops of the genera Pecten, Chlamys or Placopecten, frozen, dried, salted, in brine, or smoked, cooked or not before or during the smoking process
Follow and receive newsletters related to the following product.
HS Code: 030729 - Molluscs; scallops, whether in shell or not, including queen scallops of the genera Pecten, Chlamys or Placopecten, frozen, dried, salted, in brine, or smoked, cooked or not before or during the smoking process
Top Exporter
2021
US flagUnited States
Top Importer
2021
HK flagHong Kong
Export Value
2021
261.84MUSD
1Y -22.20%
Import Value
2021
334.43MUSD
1Y -22.92%

Export of Frozen Scallop

Discover export data of Frozen Scallop. Get export value, price data, trends, and more. The information below is based on the HS code 030729 (Molluscs; scallops, whether in shell or not, including queen scallops of the genera Pecten, Chlamys or Placopecten, frozen, dried, salted, in brine, or smoked, cooked or not before or during the smoking process).

Export Trends Overview of Top 10 Countries

See the export trends of top 10 countries that have the highest export values.
US flagUnited States
Rank 1
$40.2M
1y
+11.01%
3y
+82.59%
5y
-74.04%
CA flagCanada
Rank 2
$32.3M
1y
+63.50%
3y
+14.32%
5y
-61.75%
PE flagPeru
Rank 3
$29.4M
1y
+197.44%
3y
-11.45%
5y
-61.45%
AR flagArgentina
Rank 4
$26.6M
1y
-49.42%
3y
-2.90%
5y
-53.11%
CN flagChina
Rank 5
$19.4M
1y
-82.41%
3y
-72.12%
5y
-95.63%
DK flagDenmark
Rank 6
$18.1M
1y
+60.04%
3y
+264.18%
5y
+21.58%
HK flagHong Kong
Rank 7
$13.9M
1y
+35.84%
3y
-24.87%
5y
-76.75%
GB flagUnited Kingdom
Rank 8
$11.5M
1y
+48.64%
3y
+19.41%
5y
-85.88%
VN flagVietnam
Rank 9
$11.2M
1y
+20.91%
3y
+28.16%
5y
+57.76%
CL flagChile
Rank 10
$9.6M
1y
-5.23%
3y
+43.98%
5y
-26.40%

Export Data Summary

Get the latest export data based on the HS code System.

Trends of Top 10 Exporters

This is the export trends of the top 10 exporters of Frozen Scallop from 2014 to 2021.
Country
Export %
Export Value
19/11
19/12
20/01
20/02
20/03
20/04
20/05
20/06
20/07
20/08
20/09
20/10
20/11
20/12
21/01
21/02
21/03
21/04
21/05
21/06
21/07
21/08
21/09
21/10
21/11
21/12
22/01
22/02
22/03
22/04
22/05
22/06
1Global$71.24M$72.80M$51.05M$47.45M$48.12M$35.63M$32.98M$39.46M$44.29M$40.18M$46.71M$57.71M$50.30M$45.06M$27.02M$25.75M$54.43M$27.77M$34.08M$41.78M$58.75M$31.75M$34.41M$39.12M$43.21M$45.81M$26.45M$11.55M$10.26M$6.32M$6.65M$6.01M
2United States15.35%$7.99M$8.28M$6.26M$7.19M$7.60M$5.87M$6.12M$7.75M$5.80M$6.81M$4.68M$7.98M$6.90M$6.63M$2.71M$3.51M$4.97M$2.92M$6.02M$8.65M$9.62M$8.56M$7.11M$10.77M$7.99M$8.18M$70.15K$350.53K$442.45K$1.45M$766.68K-
3Canada12.35%$7.03M$5.75M$2.97M$7.38M$8.91M$6.51M$6.53M$8.89M$9.85M$9.20M$10.97M$8.39M$5.42M$5.39M$1.81M$2.62M$7.04M$6.24M$7.85M$9.71M$11.55M$4.36M$3.74M$5.51M$6.39M$3.62M$646.89K$1.30M$975.38K$352.57K$107.22K-
4Peru11.23%$11.44M$9.91M$5.49M$6.72M$5.50M$3.28M$2.02M$1.18M$1.98M$2.04M$3.99M$5.60M$7.92M$5.39M$3.28M$2.51M$8.99M$1.81M$4.49M$5.14M$5.94M$836.93K$2.40M$541.47K$2.40M$3.15M$1.02M$697.16K$1.19M$207.82K$142.22K-
5Argentina10.14%$6.39M$4.77M$2.43M$53.35K$3.76M$1.11M$1.31M$1.82M$3.79M$950.38K$1.43M$3.27M$766.86K$323.34K$2.65M$1.57M$3.26M$242.01K$2.21M$1.56M$3.80M$2.83M$1.91M$1.29M$3.78M$1.46M---$147.00--
6China7.39%$10.89M$15.66M$12.82M$8.98M$7.71M$8.33M$7.87M$7.28M$7.62M$6.97M$7.16M$9.45M$8.73M$9.41M$3.93M$1.46M$9.71M$1.93M$2.99M$1.44M$8.17M$1.89M$1.43M$1.51M$2.94M$5.01M$948.54K$933.12K$1.25M$470.79K$380.54K$142.55K
7Denmark6.92%$1.60M$2.38M$1.88M$1.50M$853.34K$775.21K$209.31K$790.38K$499.21K$1.17M$1.10M$2.24M$3.02M$2.14M$2.78M$1.95M$1.55M$654.50K$650.33K$1.02M$1.10M$661.78K$2.04M$1.79M$3.43M$1.87M$147.71K$100.28K$68.25K$61.55K$78.01K-
8Hong Kong5.32%$3.78M$2.89M$1.30M$880.75K$927.07K$355.35K$495.42K$1.04M$963.42K$1.24M$1.72M$2.43M$794.77K$905.96K$1.96M$455.69K$1.08M$1.79M$705.16K$728.55K$1.27M$1.58M$1.06M$1.37M$787.74K$1.65M$721.32K$1.59M$1.05M$189.44K$359.05K$270.85K
9United Kingdom4.4%$3.23M$2.68M$2.37M$2.77M$1.56M$964.34K$1.52M$1.99M$2.74M$2.99M$3.05M$3.28M$3.27M$1.47M$254.37K$2.18M$3.43M$4.68M$744.36K$4.65M$3.21M$2.58M$2.12M$3.83M$3.12M$2.91M$4.22K$34.75K$11.91K$3.08K$275.00-
10Vietnam4.28%$469.29K$973.40K$733.42K$1.70M$325.67K$945.89K$1.30M$1.44M$1.30M$1.37M$1.19M$340.55K$84.12K$832.68K$1.17M$1.22M$1.86M$1.09M$963.44K$1.31M$391.52K$1.15M$441.71K$65.09K$367.95K$1.10M$11.78K---$700.00-

Are you sourcing for Frozen Scallop?

Discover Frozen Scallop premium exhibitors on Tridge. Contact exhibitors that you are interested in and start receiving offers. Learn more about our Tridge Exhibition 365.

Explore More Through Our Services

Our Solution

Sourcing Hub

Connect and engage with thousands of credible agri-food suppliers worldwide. Find the right suppliers for your business or have the right suppliers find you.
Our Solution

Intelligence & Data

Get access to the most extensive intelligence of food and agricultural products around the globe to help you make smarter business decisions.
Our Solution

Fulfillment Solution

Source food and agricultural products efficiently from over 70 countries. We take care of everything from production to shipment for you.

Ready to list your business?

Build brand awareness and maximize your business potential when you join Exhibition 365 as an exhibitor and leverage our Ad Solutions to effortlessly connect with potential buyers worldwide through Tridge Growth Solutions.
imageimage
Who We Are

The leading global sourcing hub of food & agriculture

We provide solutions to help you not only understand the global market of food and agriculture, but also start importing products that you need right away.
By clicking “Accept Cookies,” I agree to provide cookies for statistical and personalized preference purposes. To learn more about our cookies, please read our Privacy Policy.