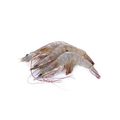
Fresh Common Shrimp & Prawn

Fresh Common Shrimp & Prawn

HS Code: 030626 - Crustaceans; not frozen, cold-water shrimps and prawns (Pandalus spp., Crangon crangon), in shell or not, smoked, cooked or not before or during smoking; in shell, cooked by steaming or by boiling in water; edible flour, meals, and pellets
Market:
Top Importer
2023
Import Value
2023
26.69KUSD
1Y -90.22%

Import of Fresh Common Shrimp & Prawn

Discover import data of Fresh Common Shrimp & Prawn. Get import value, price data, trends, and more. The information below is based on the HS code030626 (Crustaceans; not frozen, cold-water shrimps and prawns (Pandalus spp., Crangon crangon), in shell or not, smoked, cooked or not before or during smoking; in shell, cooked by steaming or by boiling in water; edible flour, meals, and pellets).

Import Trends Overview of Top 10 Importing Countries in 2023

In 2023, Palestine was the top importing country of Fresh Common Shrimp & Prawn, followed by Aruba. This ranking is based on available import data and may not include countries with missing records.
Rank 1
$26.6K
1y
3y
-81.99%
5y
+1847.59%
Rank 2
$50.0
1y
-99.98%
3y
5y
-93.28%

Notable import transactions in 2024

View notable import transactions of Fresh Common Shrimp & Prawn globally.
Rank
Rank
Company name
Company name
Import value
Import value
Import volume
Import volume
Unit price
Unit price
Origin country
Origin country
Destination country
Destination country
1
Company name
$ 46,662
00000 kg
Country name
South Korea
$ 00000 /kg
2
Company name
$ 46,662
00000 kg
Country name
South Korea
$ 00000 /kg
3
Company name
$ 41,580
00000 kg
Country name
South Korea
$ 00000 /kg
4
Company name
$ 40,120.80
00000 kg
Country name
South Korea
$ 00000 /kg
5
Company name
$ 24,024
00000 kg
Country name
South Korea
$ 00000 /kg

Unlock complete import data for Fresh Common Shrimp & Prawn

Gain full access to detailed import prices, top importers, and market insights to make data-driven decisions.

Trends of Top 10 Importers

This is the import trends of the top 10 importers of Fresh Common Shrimp & Prawn from 2017 to 2023.
Country
Import %
Import Value
22/07
22/08
22/09
22/10
22/11
22/12
23/01
23/02
23/03
23/04
23/05
23/06
23/07
23/08
23/09
23/10
23/11
23/12
24/01
24/02
24/03
24/04
24/05
24/06
24/07
24/08
24/09
24/10
24/11
24/12
25/01
25/02
1Global------$12.43K$598.00--$524.00---$10.86K$2.23K-$2.00--------------
2Palestine99.81%------$12.43K$598.00--$524.00---$10.86K$2.23K-$2.00--------------
3Aruba0.19%--------------------------------

Top Import Flows

Discover the top import flows of Fresh Common Shrimp & Prawn in 2023. The top import flow in 2023 was from Palestine to Israel, with an import value of USD 26.64K.
Trade Flow
Import Value
2023, USD
1-Year Growth in Import Value
2022-2023
3-Year Growth in Import Value
2020-2023
5-Year Growth in Import Value
2018-2023

Share of Top Importing Countries

Discover the import share of top Fresh Common Shrimp & Prawn importing countries in 2023.
Palestine held the largest share of Fresh Common Shrimp & Prawn import value at 99.81%. Its import value decreased by 0.00% between 2022 and 2023, reaching 26.64K.
Note: Share percentages are calculated based on countries with reported import data and may not include those without available records.
Country
Share in Import Value
2023
Import Value
2023, USD
1-Year Growth in Import Value
2022-2023
3-Year Growth in Import Value
2020-2023
5-Year Growth in Import Value
2018-2023
Who we are

Intelligence that moves markets. Connections that power trade.

From AI-powered intelligence to a global trade network, we help you make smarter decisions, optimize costs, and connect with the right partners—faster and easier.
By clicking “Accept Cookies,” I agree to provide cookies for statistical and personalized preference purposes. To learn more about our cookies, please read our Privacy Policy.