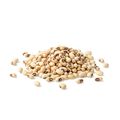
Discover production data of Dried Cowpea in Kenya. Get production volume, price data, trends, and more. The information below is based on the FAO code 0195 (Cow peas, dry).
Production Trends
This is the production trends of Dried Cowpea in Kenya from 2008 to 2022 in volume.
131.1M kg
1y
-47.61%
3y
-41.04%
5y
+6.88%
Production Volume and Price
See the production volume and price of Dried Cowpea in Kenya from 2008 to 2022.
Type
Unit
2008
2009
2010
2011
2012
2013
2014
2015
2016
2017
2018
2019
2020
2021
2022
Quantity
KG
47.96M
60.15M
72.27M
81.53M
112.95M
133.76M
138.67M
173.06M
146.81M
122.68M
193.89M
222.39M
264.16M
250.26M
131.12M
Farmgate Price
USD / Metric Ton
726.50
897.70
671.70
772.90
730.10
687.60
-
-
-
-
-
591.60
549.90
-
-
Who we are
Intelligence that moves markets. Connections that power trade.
From AI-powered intelligence to a global trade network, we help you make smarter decisions, optimize costs, and connect with the right partners—faster and easier.
By clicking “Accept Cookies,” I agree to provide cookies for statistical and personalized preference purposes.
To learn more about our cookies, please read our Privacy Policy.