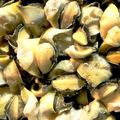
냉동 달팽이

냉동 달팽이

HS Code: 030760 - Molluscs; snails, other than sea snails, whether in shell or not, live, fresh, chilled, frozen, dried, salted, in brine, or smoked, cooked or not before or during the smoking process
|
FAO Code: 1176 - Snails, fresh, chilled, frozen, dried, salted or in brine, except sea snails
Market:
Top Exporter
2023
Top Importer
2023
Top Producer
2023
Export Value
2023
64.10MUSD
1Y +13.94%
Import Value
2023
71.05MUSD
1Y +15.12%
Production Volume
2023
19.86MKG
1Y +1.82%

Production of 냉동 달팽이

Discover production data of 냉동 달팽이. Get production volume, price data, trends, and more. The information below is based on the FAO code 1176 (Snails, fresh, chilled, frozen, dried, salted or in brine, except sea snails).

Production Trends Overview of Top 10 Countries

In 2023, 모로코 was the largest producer of 냉동 달팽이, followed by 튀니지, 튀르키예, 코트디부아르. This ranking is based on available production data and may exclude countries with missing records.
Rank 1
18.0M kg
1y
+1.95%
3y
+6.69%
5y
+7.24%
Rank 2
1.0M kg
1y
+0.26%
3y
+1.28%
5y
+1.69%
532.7K kg
1y
-0.25%
3y
-1.38%
5y
-3.13%
318.0K kg
1y
+3.17%
3y
+8.45%
5y
+11.20%

Trends of Top 10 Producers

This is the production trends of the top 10 producers of 냉동 달팽이 from 2009 to 2023.
CountryProduction %Production Volume
200920102011201220132014201520162017201820192020202120222023
1Global16.68M16.60M16.63M16.69M17.23M17.75M18.61M17.87M18.01M18.61M18.47M18.70M19.09M19.50M19.86M
2모로코90.61%15.00M15.00M15.00M14.99M15.41M15.86M16.82M16.03M16.18M16.78M16.64M16.87M17.24M17.65M17.99M
3튀니지5.1%1.00M900.00K900.00K921.45K985.57K1.05M963.00K1.00M998.60K996.47K997.37K1.00M1.01M1.01M1.01M
4튀르키예2.68%500.00K500.00K500.00K520.23K560.14K563.14K557.16K560.15K549.59K549.91K546.90K540.17K535.37K534.03K532.69K
5코트디부아르1.6%180.00K195.00K225.00K250.00K270.00K279.76K275.68K280.54K290.57K285.98K290.04K293.23K300.97K308.26K318.02K

Shares of Top 10 Producers

Discover the production share of top 냉동 달팽이 producing countries in 2023.
모로코 held the largest share of 냉동 달팽이 production quantity at 90.61%. Its production quantity increased by 1.95% between 2022 and 2023, reaching 17.99M.
Note: Share percentages are calculated based on countries with reported production data and may not include those without available records.
Rank
Country
Share in Production
2023
Production Quantity
2023
1-Year Growth in Qty
2022-2023
3-Year Growth in Qty
2020-2023
5-Year Growth in Qty
2018-2023
Who we are

Intelligence that moves markets. Connections that power trade.

From AI-powered intelligence to a global trade network, we help you make smarter decisions, optimize costs, and connect with the right partners—faster and easier.
By clicking “Accept Cookies,” I agree to provide cookies for statistical and personalized preference purposes. To learn more about our cookies, please read our Privacy Policy.