Unlock the full potential of Tridge's Data & Analytics with Premium Access
Elevate Your Competitive Analysis
Enhanced Data Portability & Detail
Exclusive Access for Informed Decisions
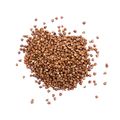
Production of Buckwheat
Discover production data of Buckwheat. Get production volume, price data, trends, and more. The information below is based on the FAO code 0089 (Buckwheat).
Production Trends Overview of Top 10 Countries
See the production trends of the top 10 countries that have the highest production volumes.
RussiaRank 1
ChinaRank 2
UkraineRank 3
United StatesRank 4
BrazilRank 5
JapanRank 6
KazakhstanRank 7
BelarusRank 8
TanzaniaRank 9
NepalRank 10
Trends of Top 10 Producers
This is the production trends of the top 10 producers of Buckwheat from 2006 to 2020.
| Country | Production % | Production Volume |
---|
2006 | 2007 | 2008 | 2009 | 2010 | 2011 | 2012 | 2013 | 2014 | 2015 | 2016 | 2017 | 2018 | 2019 | 2020 |
---|
1 | Global | | 1.94M | 2.38M | 2.22M | 1.80M | 1.45M | 2.37M | 2.26M | 2.26M | 1.92M | 1.92M | 2.59M | 3.04M | 1.89M | 1.70M | 1.81M |
2 | Russia | 49.27% | 865.24K | 1.00M | 924.11K | 564.04K | 339.29K | 800.38K | 796.55K | 833.94K | 661.76K | 861.24K | 1.19M | 1.52M | 931.71K | 785.70K | 892.16K |
3 | China | 27.83% | 440.00K | 650.00K | 640.00K | 570.00K | 500.00K | 780.00K | 675.00K | 633.00K | 564.90K | 421.75K | 539.88K | 508.84K | 490.16K | 512.96K | 503.99K |
4 | Ukraine | 5.39% | 229.20K | 217.40K | 240.60K | 188.60K | 133.70K | 281.60K | 238.70K | 179.02K | 167.44K | 128.10K | 176.43K | 180.44K | 137.01K | 85.02K | 97.64K |
5 | United States | 4.77% | 66.00K | 68.00K | 83.00K | 84.98K | 79.77K | 79.62K | 82.00K | 81.00K | 83.00K | 83.29K | 83.39K | 83.90K | 84.89K | 85.59K | 86.40K |
6 | Brazil | 3.6% | 51.00K | 52.00K | 53.40K | 54.48K | 55.53K | 57.00K | 60.00K | 62.00K | 64.00K | 61.39K | 62.06K | 62.65K | 63.56K | 64.45K | 65.12K |
7 | Japan | 2.47% | 33.00K | 26.30K | 23.20K | 15.30K | 29.70K | 32.00K | 44.60K | 33.40K | 31.10K | 34.80K | 28.80K | 34.40K | 29.00K | 42.60K | 44.80K |
8 | Kazakhstan | 2.21% | 58.93K | 81.40K | 16.57K | 61.58K | 26.96K | 37.43K | 48.04K | 83.57K | 46.53K | 45.41K | 89.62K | 120.38K | 82.70K | 45.00K | 40.09K |
9 | Belarus | 1.56% | 5.14K | 13.00K | 18.02K | 19.43K | 18.40K | 44.47K | 39.33K | 30.33K | 18.38K | 11.64K | 13.09K | 18.01K | 18.53K | 16.96K | 28.30K |
10 | Tanzania | 1.42% | 4.00K | 5.00K | 6.00K | 7.50K | 8.00K | 8.80K | 18.00K | 20.00K | 20.00K | 21.00K | 21.00K | 22.00K | 22.00K | 23.09K | 25.77K |
Shares of Top 10 Producers
These are shares of top 10 producers of Buckwheat in 2020.
1-Year Growth in Qty2019-2020
3-Year Growth in Qty2017-2020
5-Year Growth in Qty2015-2020