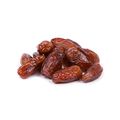
Production of 신선 대추야자
Discover production data of 신선 대추야자. Get production volume, price data, trends, and more. The information below is based on the FAO code 0577 (Dates).
Related Market Brief Curations
Discover curated market data on production for 신선 대추야자.
Production Trends Overview of Top 10 Countries
In 2023, 이집트 was the largest producer of 신선 대추야자, followed by 사우디아라비아, 알제리, 이란, 이라크, 파키스탄, 수단, 오만, 튀니지, 아랍 에미리트 연합국. This ranking is based on available production data and may exclude countries with missing records.
Rank 1
1.9B kg
1y
+1.05%
3y
+9.11%
5y
+19.40%
Rank 2
1.6B kg
1y
+2.00%
3y
+6.57%
5y
+26.11%
Rank 3
1.3B kg
1y
+6.45%
3y
+15.01%
5y
+21.02%
Rank 4
1.0B kg
1y
-0.62%
3y
-17.23%
5y
-24.51%
Rank 5
635.9M kg
1y
-10.55%
3y
-13.52%
5y
-1.58%
Rank 6
503.8M kg
1y
+120.42%
3y
-10.07%
5y
+12.71%
Rank 7
442.7M kg
1y
-0.01%
3y
-4.87%
5y
+7.03%
Rank 8
394.9M kg
1y
+4.77%
3y
+7.15%
5y
+7.09%
Rank 9
386.4M kg
1y
+4.71%
3y
+16.38%
5y
+26.69%
Rank 10
329.4M kg
1y
-6.25%
3y
-6.26%
5y
-4.54%
Trends of Top 10 Producers
This is the production trends of the top 10 producers of 신선 대추야자 from 2009 to 2023.
Shares of Top 10 Producers
Discover the production share of top 신선 대추야자 producing countries in 2023.
이집트 held the largest share of 신선 대추야자 production quantity at 19.33%. Its production quantity increased by 1.05% between 2022 and 2023, reaching 1.87B.
Note: Share percentages are calculated based on countries with reported production data and may not include those without available records.
Related Information
Other products in 과일
By clicking “Accept Cookies,” I agree to provide cookies for statistical and personalized preference purposes. To learn more about our cookies, please read our Privacy Policy.


