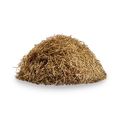
Hay
HS Code: 121490 - Forage products including swedes, mangolds, fodder roots, hay, sainfoin, clover, forage kale, lupines, vetches etc., pelletised or otherwise
Market:
Top Exporter
2023

Top Importer
2023

Export Value
2023
3BUSD
1Y -17.20%
Import Value
2023
2.96BUSD
1Y -15.46%
Import of Hay
Discover import data of Hay. Get import value, price data, trends, and more. The information below is based on the HS code121490 (Forage products including swedes, mangolds, fodder roots, hay, sainfoin, clover, forage kale, lupines, vetches etc., pelletised or otherwise).
Import Trends Overview of Top 10 Importing Countries in 2023
In 2023, Japan was the top importing country of Hay, followed by China, Saudi Arabia, South Korea, United Arab Emirates, United States, Switzerland, Netherlands, Canada, Hong Kong. This ranking is based on available import data and may not include countries with missing records.
Rank 1
$756.0M
1y
-23.38%
3y
-3.42%
5y
+0.31%

Rank 2
$537.9M
1y
-45.74%
3y
-11.36%
5y
+2.21%

Rank 3
$445.8M
1y
+86.10%
3y
+82.78%
5y
+107.36%

Rank 4
$364.2M
1y
-17.93%
3y
+15.01%
5y
+8.05%

Rank 5
$245.5M
1y
-10.93%
3y
+128.19%
5y
+116.81%
Rank 6
$140.9M
1y
-8.20%
3y
+63.98%
5y
+111.08%

Rank 7
$76.1M
1y
+7.49%
3y
+69.73%
5y
-1.13%

Rank 8
$51.6M
1y
+25.01%
3y
-1.74%
5y
+39.61%

Rank 9
$34.2M
1y
+72.31%
3y
+77.02%
5y
+92.26%

Rank 10
$33.3M
1y
+472.24%
3y
+1211.66%
5y
+3296.19%
Notable import transactions in 2024
View notable import transactions of Hay globally.
Unlock complete import data for Hay
Gain full access to detailed import prices, top importers, and market insights to make data-driven decisions.
Trends of Top 10 Importers
This is the import trends of the top 10 importers of Hay from 2017 to 2023.
Top Import Flows
Discover the top import flows of Hay in 2023. The top import flow in 2023 was from Japan to United States, with an import value of USD 479.34M.
Share of Top Importing Countries
Discover the import share of top Hay importing countries in 2023.
Japan held the largest share of Hay import value at 25.54%. Its import value decreased by -23.38% between 2022 and 2023, reaching 756.02M.
Note: Share percentages are calculated based on countries with reported import data and may not include those without available records.
Related Countries
Related exporters and importers
Related Information
People who viewed Hay also viewed
Other products in Grains, Cereal & Legumes
Other products in Grain & Cereals
By clicking “Accept Cookies,” I agree to provide cookies for statistical and personalized preference purposes. To learn more about our cookies, please read our Privacy Policy.
By clicking “Accept Cookies,” I agree to provide cookies for statistical and personalized preference purposes. To learn more about our cookies, please read our Privacy Policy.