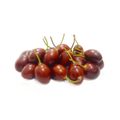
Mahua

Mahua

HS Code: 081090 - Fruit, edible; fruits n.e.c. in heading no. 0801 to 0810, fresh
Market:
Top Exporter
2022
NL flagNetherlands
Top Importer
2022
CN flagChina
Export Value
2022
1.52BUSD
1Y -65.06%
Import Value
2022
2.98BUSD
1Y -27.77%

Unlock the full potential of Tridge's Data & Analytics with Premium Access

Elevate Your Competitive Analysis
Enhanced Data Portability & Detail
Exclusive Access for Informed Decisions
Already subscribed?

Overview of Global Mahua Market

Browse trends of top exporting countries of Mahua with a summary of price and seasonality data for each market.
Rank 1
2022
NL flagNetherlands
$292.4M
Export Value
Share in Export Value
-
Weekly Price Change
-
Monthly Price Change
-
Harvesting Seasonality
-
Rank 2
2022
CN flagChina
$202.2M
Export Value
Share in Export Value
-
Weekly Price Change
-
Monthly Price Change
-
Harvesting Seasonality
-
Rank 3
2022
EG flagEgypt
$135.5M
Export Value
Share in Export Value
-
Weekly Price Change
-
Monthly Price Change
-
Harvesting Seasonality
-
Rank 4
2022
TR flagTurkiye
$119.1M
Export Value
Share in Export Value
-
Weekly Price Change
-
Monthly Price Change
-
Harvesting Seasonality
-
Rank 5
2022
ES flagSpain
$87.6M
Export Value
Share in Export Value
-
Weekly Price Change
-
Monthly Price Change
-
Harvesting Seasonality
-
Rank 6
2022
HK flagHong Kong
$87.2M
Export Value
Share in Export Value
-
Weekly Price Change
-
Monthly Price Change
-
Harvesting Seasonality
-
Rank 7
2022
IN flagIndia
$78.1M
Export Value
Share in Export Value
-
Weekly Price Change
-
Monthly Price Change
-
Harvesting Seasonality
-
Rank 8
2022
US flagUnited States
$61.1M
Export Value
Share in Export Value
-
Weekly Price Change
-
Monthly Price Change
-
Harvesting Seasonality
-
Rank 9
2022
MX flagMexico
$58.3M
Export Value
Share in Export Value
-
Weekly Price Change
-
Monthly Price Change
-
Harvesting Seasonality
-
Rank 10
2022
ZA flagSouth Africa
$40.9M
Export Value
Share in Export Value
-
Weekly Price Change
-
Monthly Price Change
-
Harvesting Seasonality
-
Rank
Country
Share in Export Value
2022
Export Value
2022, USD
1-Year Growth in Export Value
2021-2022
3-Year Growth in Export Value
2019-2022
Weekly Price Index Change
Monthly Price Index Change
2024-03
Harvesting Seasonality
1
Netherlands
19.24%
$292.43M
-11.14%
-0.41%
-
2
China
13.30%
$202.24M
-19.64%
-17.40%
-
3
Egypt
8.91%
$135.46M
+89.49%
+88.34%
-
4
Turkiye
7.84%
$119.12M
-11.42%
+21.34%
-
5
Spain
5.76%
$87.61M
-12.89%
-8.88%
-
6
Hong Kong
5.74%
$87.19M
-62.74%
-28.05%
-
7
India
5.14%
$78.09M
-18.50%
-31.82%
-
8
United States
4.02%
$61.15M
-16.45%
-12.76%
-
9
Mexico
3.84%
$58.32M
-1.74%
+104.39%
-
10
South Africa
2.69%
$40.92M
+18.30%
+22.88%
-
Top exporting country list is based on HS code 081090 which is the representative HS code for Mahua

Basic Suppliers

Discover Mahua basic suppliers on Tridge and build business partnerships.
image
EMT INTERNATIONAL EXPO
image
IN flag
India ·
image
Products: Honey · Mahua
image

News

Read the latest agricultural news of Mahua, including updates on policy, business, technology, and more.

Prices of Mahua

Discover price data of wholesale and farmgate prices of Mahua. See the price changes and trends of countries or varieties you are interested in. The price data on this page are wholesale price or farmgate price data collected from trusted local sources. These prices are intended for basic market indication and benchmarking only.

Export

Discover export data of Mahua. Get export value, price data, trends, and more. The information below is based on the HS code 081090 (Fruit, edible; fruits n.e.c. in heading no. 0801 to 0810, fresh).

Import

Discover import data of Mahua. Get import value, price data, trends, and more. The information below is based on the HS code 081090 (Fruit, edible; fruits n.e.c. in heading no. 0801 to 0810, fresh).

No data available

Sorry, we do not have Mahua data at the moment. Try searching for other products or select products related to Mahua from below.

Explore More Through Our Services

Our Solution

Data & Analytics

Access actionable agri-food data and gain a deep understanding of global market dynamics and trends to enhance your business efficiency.
Our Solution

Insights

Keep track of the latest events and issues happening around the world through our in-depth contents and curation of relevant news.
Our Solution

Social Marketplace

Connect and engage with players in the agri-food industry in Tridge Social Marketplace. Build long-term relationships founded on trust.
Our Solution

Fulfillment Solution

Source food and agricultural products efficiently from over 70 countries. We take care of everything from production to shipment for you.
image
Who We Are

The leading global sourcing hub of food & agriculture

We provide solutions to help you not only understand the global market of food and agriculture, but also start importing products that you need right away.
By clicking “Accept Cookies,” I agree to provide cookies for statistical and personalized preference purposes. To learn more about our cookies, please read our Privacy Policy.