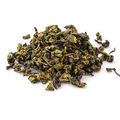
우롱차
HS Code: 0902 - Tea
Market:
Share in Export
2023
0.00%Rank 89
Share in Import
2023
0.29%Rank 49
Export Volume
2023
20.16KKG
1Y -25.96%
Import Volume
2023
1Y
Export of 우롱차 From 바레인
Discover export data of 우롱차 from 바레인. Get export value, volume, price data, trends and more. The information below is based on the HS code 0902 (Tea).
Overview of Exports
In 2023, the export value of 우롱차 from 바레인 was USD 235.99K, with a total export volume of 20.16 metric tons.
in 2023
$236.0K
USD
1y
+266.26%
3y
+115.12%
5y
+70.99%
in 2023
20.2K
KG
1y
-25.96%
3y
+62.04%
5y
+18.68%
Share of Top Exporting Destinations
See the export destination share of 우롱차 from 바레인 in 2023.
The top importing countries of 바레인's 우롱차 include 사우디아라비아, 아랍 에미리트 연합국, 쿠웨이트, 오만, 니제르, 요르단, 영국, 이라크, 케냐.
Among them, 사우디아라비아 was the largest importer, accounting for 48.04%% of total 바레인 우롱차 exports.
Are you sourcing for 우롱차?
Discover 우롱차 premium suppliers on Tridge. Contact suppliers that you are interested in and start receiving offers. Learn more about finding suppliers.
By clicking “Accept Cookies,” I agree to provide cookies for statistical and personalized preference purposes. To learn more about our cookies, please read our Privacy Policy.