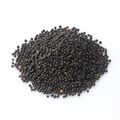
Export of Canola Seed & Rapeseed
Discover export data of Canola Seed & Rapeseed. Get export value, price data, trends, and more. The information below is based on the HS code 120510 (Oil seeds; low erucic acid rape or colza seeds, whether or not broken).
Export Trends Overview of Top 10 Countries
See the export trends of top 10 countries that have the highest export values.
CanadaRank 1
AustraliaRank 2
UkraineRank 3
NetherlandsRank 4
FranceRank 5
RomaniaRank 6
LithuaniaRank 7
HungaryRank 8
LatviaRank 9
GermanyRank 10
Export Data Summary
Get the latest export data based on the HS code System.
Trends of Top 10 Exporters
This is the export trends of the top 10 exporters of Canola Seed & Rapeseed from 2014 to 2021.
| | | |
---|
| | | | | | | | | | | | | | | | | | | | | | | | | | | | | | | |
---|
1 | Global | | $771.32M | $688.69M | $806.31M | $666.70M | $941.74M | $693.96M | $752.81M | $638.76M | $857.29M | $1.20B | $1.11B | $979.19M | $1.08B | $951.09M | $1.12B | $876.03M | $1.27B | $939.09M | $1.16B | $935.88M | $1.14B | $1.46B | $1.20B | $1.49B | $1.63B | $1.24B | $1.48B | $1.27B | $1.44B | $1.35B | $1.10B | $956.14K |
2 | Canada | 39.43% | $351.97M | $272.80M | $386.05M | $327.75M | $514.53M | $419.28M | $407.18M | $307.26M | $380.12M | $341.42M | $465.78M | $488.54M | $542.67M | $459.74M | $492.25M | $487.02M | $568.97M | $386.66M | $503.86M | $461.54M | $373.22M | $165.39M | $320.52M | $687.98M | $594.78M | $453.72M | $435.51M | $263.24M | $261.53M | $223.55M | $306.54M | - |
3 | Australia | 16.99% | $34.55M | $118.29M | $136.80M | $104.00M | $188.46M | $65.17M | $154.01M | $56.49M | $1.29M | $851.06K | $5.88M | $1.26M | $107.05M | $129.74M | $295.91M | $121.64M | $406.89M | $294.93M | $321.28M | $121.80M | $210.62M | $117.60M | $68.26M | $36.79M | $353.03M | $253.94M | $594.34M | $435.02M | $691.45M | $712.46M | $652.73M | - |
4 | Ukraine | 10.16% | $98.79M | $76.48M | $24.79M | $17.28M | $34.68M | $18.35M | $16.84M | $22.24M | $74.53M | $359.04M | $226.50M | $130.52M | $183.55M | $127.50M | $57.91M | $61.18M | $19.92M | $17.74M | $788.15K | $220.78K | $31.90M | $438.55M | $317.14M | $413.79M | $211.38M | $55.42M | $30.10M | $24.09M | $20.19M | $13.56M | $8.87M | - |
5 | Netherlands | 7.31% | $53.63M | $57.32M | $67.96M | $53.34M | $28.63M | $54.00M | $38.18M | $61.13M | $44.53M | $90.44M | $118.57M | $101.18M | $104.30M | $82.52M | $105.80M | $51.01M | $92.53M | $51.99M | $77.79M | $49.45M | $80.29M | $84.34M | $83.56M | $70.30M | $92.73M | $119.09M | $94.16M | $53.36M | $72.39M | $90.56M | $3.58M | - |
6 | France | 6.07% | $16.52M | $39.49M | $39.24M | $54.91M | $40.11M | $50.82M | $50.70M | $86.01M | $109.74M | $38.06M | $54.25M | $36.42M | $21.18M | $32.78M | $38.79M | $42.30M | $54.90M | $75.92M | $85.42M | $140.08M | $123.40M | $104.15M | $47.54M | $44.75M | $114.23M | $112.12M | $50.99M | $105.30M | $93.69M | $42.91M | $2.17M | $973.00 |
7 | Romania | 3% | $23.51M | $3.77M | $1.78M | $1.63M | $1.58M | $464.61K | $329.48K | $1.02M | $36.90M | $48.11M | $22.67M | $16.18M | $9.68M | $5.71M | $3.90M | $2.00M | $2.97M | $2.30M | $1.57M | $3.05M | $65.35M | $115.50M | $76.88M | $59.91M | $22.21M | $34.17M | $54.63M | $11.78M | $13.01M | $6.52M | $1.15M | - |
8 | Lithuania | 1.98% | $5.68M | $5.11M | $33.21M | $6.66M | $8.92M | $1.83M | $7.70M | $3.39M | $34.67M | $75.95M | $49.82M | $65.86M | $7.77M | $24.53M | $28.00M | $5.97M | $19.80M | $10.83M | $4.12M | $2.78M | $25.69M | $98.04M | $76.37M | $21.19M | $39.83M | $52.86M | $41.38M | $31.73M | $15.71M | $11.76M | $7.60M | - |
9 | Hungary | 1.85% | $21.15M | $13.29M | $16.97M | $25.62M | $29.31M | $14.03M | $25.55M | $27.98M | $45.73M | $25.05M | $19.10M | $15.48M | $16.26M | $19.26M | $14.95M | $11.06M | $16.60M | $19.41M | $19.79M | $21.50M | $43.36M | $24.96M | $14.88M | $14.08M | $24.09M | $23.47M | $23.54M | $26.40M | $28.35M | $31.42M | $7.83M | - |
10 | Latvia | 1.69% | $40.28M | $19.45M | $15.39M | $2.32M | $7.02M | $4.85M | $7.66M | $7.94M | $4.08M | $48.73M | $47.35M | $42.31M | $26.12M | $11.72M | $7.48M | $10.64M | $4.17M | $3.74M | $2.62M | $2.27M | $5.79M | $78.45M | $67.42M | $43.35M | $17.22M | $11.47M | $11.48M | $18.87M | $23.30M | $10.56M | $9.90M | - |
Top Export Flows
Discover the top export flows of Canola Seed & Rapeseed in 2021. The top export flow in 2021 was from Canada to China, with an export value of USD 1.40B.
1-Year Growth in Export Value2020-2021
3-Year Growth in Export Value2018-2021
5-Year Growth in Export Value2016-2021
Share of Top Exporting Countries
Discover the share of top 10 exporting countries of Canola Seed & Rapeseed in 2021.
Share in Export Value2021
1-Year Growth in Export Value2020-2021
3-Year Growth in Export Value2018-2021
5-Year Growth in Export Value2016-2021
Are you sourcing for Canola Seed & Rapeseed?