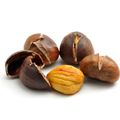
Chestnut Kernel

Chestnut Kernel

HS Code: 080241 - Nuts, edible; chestnuts (Castanea spp.), fresh or dried, in shell
|
FAO Code: 0220 - Chestnuts, in shell
Market:
Top Exporter
2023
TR flagTurkiye
Top Importer
2023
CH flagSwitzerland
Top Producer
2022
CN flagChina
Export Value
2023
69.56MUSD
1Y -72.17%
Import Value
2023
81.36MUSD
1Y -65.20%
Production Volume
2022
2.48BKG
1Y -0.63%

Export of Chestnut Kernel

Discover export data of Chestnut Kernel. Get export value, price data, trends, and more. The information below is based on the HS code 080241 (Nuts, edible; chestnuts (Castanea spp.), fresh or dried, in shell).

Export Trends Overview of Top 10 Countries

See the export trends of top 10 countries that have the highest export values.
TR flagTurkiye
Rank 1
$27.1M
1y
-21.15%
3y
+12.67%
5y
-37.32%
PT flagPortugal
Rank 2
$20.7M
1y
+89.38%
3y
-5.06%
5y
-55.36%
GR flagGreece
Rank 3
$8.3M
1y
-4.42%
3y
-31.42%
5y
-31.55%
CL flagChile
Rank 4
$7.8M
1y
+44.00%
3y
+69.91%
5y
+231.20%
NL flagNetherlands
Rank 5
$2.2M
1y
+52.15%
3y
+56.60%
5y
+29.11%
GE flagGeorgia
Rank 6
$911.2K
1y
+60.27%
3y
+48.64%
5y
+268.14%
DE flagGermany
Rank 7
$767.9K
1y
-14.47%
3y
-46.00%
5y
-31.07%
GB flagUnited Kingdom
Rank 8
$368.1K
1y
+171.19%
3y
+136.64%
5y
+62.39%
US flagUnited States
Rank 9
$311.5K
1y
+179.08%
3y
-70.30%
5y
-44.31%
BR flagBrazil
Rank 10
$244.7K
1y
+80.77%
3y
+8785.48%
5y
+17542.83%

Trends of Top 10 Exporters

This is the export trends of the top 10 exporters of Chestnut Kernel from 2016 to 2023.
Country
Export %
Export Value
21/05
21/06
21/07
21/08
21/09
21/10
21/11
21/12
22/01
22/02
22/03
22/04
22/05
22/06
22/07
22/08
22/09
22/10
22/11
22/12
23/01
23/02
23/03
23/04
23/05
23/06
23/07
23/08
23/09
23/10
23/11
23/12
1Global$5.63M$4.06M$3.49M$2.05M$27.14M$74.01M$80.92M$44.19M$13.47M$6.17M$3.92M$3.53M$5.03M$6.09M$4.85M$4.45M$27.55M$66.13M$63.60M$39.87M$11.94M$8.50M$7.01M$4.22M$5.67M$9.32M$3.79M$5.37M$19.49M$31.89M$32.24M$14.93M
2Turkiye38.97%$129.89K---$18.46K$3.61M$17.70M$11.45M$2.41M$233.64K$64.65K-$30.00---$41.67K$2.11M$16.51M$13.01M$1.57M$139.66K$23.05K$468.00-----$546.95K-$8.57M
3Portugal29.75%$178.68K$113.89K$55.27K$30.16K$1.31M$3.83M$13.49M$5.80M$988.01K$411.82K$145.74K$73.89K$56.12K$64.77K$50.58K$67.85K$113.89K$1.41M$6.38M$991.03K$567.11K$1.06M$355.79K$251.95K$254.12K$443.22K$414.02K$264.50K$559.35K$1.45M$7.76M$4.12M
4Greece11.94%----$5.54K$12.08M$1.24M$961.25K$231.97K$47.91K$705.00$1.01K$425.00$15.34K$88.00$127.00$638.88K$5.33M$1.41M$568.99K$15.13K$2.63K$23.89K$26.42K$206.00$202.00$107.00$295.00$1.04K$4.92M$2.28M$914.55K
5Chile11.26%$1.97M$2.27M$1.15M$2.86K$183.45K-------$718.37K$3.02M$1.16M$224.21K$107.70K$105.63K$111.63K----$62.64K$2.15M$4.69M$639.22K$133.68K$137.34K---
6Netherlands3.23%$37.88K$73.77K$98.11K$88.30K$116.80K$227.44K$650.98K$274.72K$133.02K$64.33K$57.46K$14.50K$14.43K$11.17K$6.71K$8.28K$68.60K$120.63K$437.23K$239.60K$82.98K$42.70K$113.99K$4.08K$7.45K$4.58K$7.56K$6.02K$96.36K$482.41K$799.85K$591.20K
7Georgia1.31%$6.73K---$39.31K$164.97K$144.38K$41.69K$5.20K$6.00K$52.80K-----$6.74K$261.00K$124.92K$111.87K$66.55K$57.54K$101.07K-----$22.80K$395.40K$151.17K$116.65K
8Germany1.1%$5.72K$1.39K$2.01K$1.78K$10.83K$139.67K$302.04K$308.52K$284.86K$38.71K$10.50K$2.22K$3.02K$825.00$1.79K$3.32K$14.90K$84.82K$238.96K$244.68K$119.84K$14.92K$3.22K$1.86K$2.01K$2.05K$4.46K$3.08K$10.39K$61.65K$336.40K$207.48K
9United Kingdom0.53%-$3.64K-$37.00-$33.00$81.12K$80.00$15.00$81.00--$80.76K$122.00$173.00$103.00$117.00$20.00$41.97K$10.78K$3.78K$10.25K----$77.60K$12.71K-$173.10K$78.49K$11.19K
10United States0.45%-$66.78K--$34.43K$35.15K$7.18K$2.56K----$11.02K-$7.04K$70.42K$6.09K$13.55K$3.52K---$104.14K------$94.66K-$112.75K

Top Export Flows

Discover the top export flows of Chestnut Kernel in 2023. The top export flow in 2023 was from Turkiye to Italy, with an export value of USD 18.55M.

Share of Top Exporting Countries

Discover the share of top 10 exporting countries of Chestnut Kernel in 2023.
EUROPE
ASIA
SOUTH AMERICA
NORTH AMERICA
OCEANIA
OTHERS

Are you sourcing for Chestnut Kernel?

Discover Chestnut Kernel premium suppliers on Tridge. Contact suppliers that you are interested in and start receiving offers. Learn more about finding suppliers.

Explore More Through Our Services

Our Solution

Data & Analytics

Access actionable agri-food data and gain a deep understanding of global market dynamics and trends to enhance your business efficiency.
Our Solution

Insights

Keep track of the latest events and issues happening around the world through our in-depth contents and curation of relevant news.
Our Solution

Find Suppliers

Connect and engage with thousands of credible agri-food suppliers worldwide. Browse through their products and connect with them in real-time.
Our Solution

Find Buyers

Discover reliable buyers looking for your products and establish long-term relationships. Respond to their RFQs with your quotes.
image
Who We Are

The leading global sourcing hub of food & agriculture

We provide solutions to help you not only understand the global market of food and agriculture, but also start importing products that you need right away.
By clicking “Accept Cookies,” I agree to provide cookies for statistical and personalized preference purposes. To learn more about our cookies, please read our Privacy Policy.