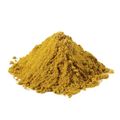
Fishmeal
HS Code: 230120 - Flours, meals and pellets; of fish or of crustaceans, molluscs or other aquatic invertebrates
Market:
Share in Export
2023
1.00%Rank 20
Share in Import
2023
0.07%Rank 48
Export Volume
2023
40.34MKG
1Y +16.32%
Import Volume
2023
2.01MKG
1Y -8.72%
Export of Fishmeal From Brazil
Discover export data of Fishmeal from Brazil. Get export value, volume, price data, trends and more. The information below is based on the HS code 230120 (Flours, meals and pellets; of fish or of crustaceans, molluscs or other aquatic invertebrates).
Overview of Exports
In 2023, the export value of Fishmeal from Brazil was USD 47.69M, with a total export volume of 40.34K metric tons.
in 2023
$47.7M
USD
1y
+36.91%
3y
+133.03%
5y
+297.75%
in 2023
40.3M
KG
1y
+16.32%
3y
+81.81%
5y
+223.55%
Notable export transactions in 2024
View notable export transactions of Fishmeal from Brazil.
Unlock complete export data for Fishmeal from Brazil
Gain full access to detailed export prices, top exporters, and market insights to make data-driven decisions.
Share of Top Exporting Destinations
See the export destination share of Fishmeal from Brazil in 2023.
The top importing countries of Brazil's Fishmeal include Vietnam, United States, Nigeria, Myanmar [Burma], Chile, Costa Rica, South Korea, Venezuela, Bangladesh.
Among them, Vietnam was the largest importer, accounting for 44.13%% of total Brazil Fishmeal exports.
Are you sourcing for Fishmeal?
Discover Fishmeal premium suppliers on Tridge. Contact suppliers that you are interested in and start receiving offers. Learn more about finding suppliers.
Related Countries
Related exporters and importers
Related Information
People who viewed Fishmeal also viewed
Other products in Agricultural By-products
By clicking “Accept Cookies,” I agree to provide cookies for statistical and personalized preference purposes. To learn more about our cookies, please read our Privacy Policy.
By clicking “Accept Cookies,” I agree to provide cookies for statistical and personalized preference purposes. To learn more about our cookies, please read our Privacy Policy.