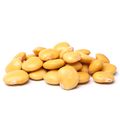
Lupin

Lupin

HS Code: 121490 - Forage products including swedes, mangolds, fodder roots, hay, sainfoin, clover, forage kale, lupines, vetches etc., pelletised or otherwise
|
FAO Code: 0210 - Lupins
Market:
Top Exporter
2023
US flagUnited States
Top Importer
2023
US flagUnited States
Top Producer
2022
AU flagAustralia
Export Value
2023
2.53BUSD
1Y -30.30%
Import Value
2023
401.12MUSD
1Y -87.85%
Production Volume
2022
2.06BKG
1Y -19.83%

Export of Lupin

Discover export data of Lupin. Get export value, price data, trends, and more. The information below is based on the HS code 121490 (Forage products including swedes, mangolds, fodder roots, hay, sainfoin, clover, forage kale, lupines, vetches etc., pelletised or otherwise).

Export Trends Overview of Top 10 Countries

See the export trends of top 10 countries that have the highest export values.
US flagUnited States
Rank 1
$1.5B
1y
-22.23%
3y
-1.11%
5y
+11.61%
AU flagAustralia
Rank 2
$610.7M
1y
+7.04%
3y
+62.01%
5y
+49.59%
CA flagCanada
Rank 3
$197.6M
1y
-6.62%
3y
+38.79%
5y
+50.30%
NL flagNetherlands
Rank 4
$67.6M
1y
+14.87%
3y
+27.88%
5y
+73.50%
DE flagGermany
Rank 5
$44.3M
1y
+6.40%
3y
+29.00%
5y
+13.01%
CL flagChile
Rank 6
$11.6M
1y
-8.73%
3y
-6.90%
5y
+13.08%
PL flagPoland
Rank 7
$9.6M
1y
-11.96%
3y
+18.44%
5y
-21.69%
CZ flagCzechia
Rank 8
$9.1M
1y
+124.08%
3y
+205.32%
5y
+59.85%
ZA flagSouth Africa
Rank 9
$7.6M
1y
-64.28%
3y
-43.99%
5y
+117.09%
MX flagMexico
Rank 10
$7.2M
1y
+130.97%
3y
-
5y
-

Trends of Top 10 Exporters

This is the export trends of the top 10 exporters of Lupin from 2016 to 2023.
Country
Export %
Export Value
21/05
21/06
21/07
21/08
21/09
21/10
21/11
21/12
22/01
22/02
22/03
22/04
22/05
22/06
22/07
22/08
22/09
22/10
22/11
22/12
23/01
23/02
23/03
23/04
23/05
23/06
23/07
23/08
23/09
23/10
23/11
23/12
1Global$250.07M$245.67M$236.54M$290.26M$262.25M$246.90M$276.81M$283.62M$246.78M$273.14M$280.22M$263.97M$286.43M$274.16M$298.23M$364.88M$353.70M$325.85M$304.62M$309.71M$219.90M$231.41M$245.79M$256.22M$271.94M$244.44M$235.11M$260.41M$235.74M$220.36M$219.23M$208.34M
2United States60.2%$152.06M$137.18M$123.75M$156.40M$143.81M$159.64M$142.95M$145.96M$130.10M$157.29M$167.03M$169.78M$166.87M$132.11M$152.75M$175.24M$181.63M$179.71M$181.40M$160.76M$114.56M$125.43M$133.99M$119.15M$125.36M$135.89M$120.04M$127.23M$138.86M$125.81M$130.26M$123.58M
3Australia24.18%$35.36M$33.54M$32.47M$35.10M$26.69M$41.17M$41.72M$54.45M$51.85M$45.96M$42.29M$38.40M$55.82M$44.37M$32.32M$53.22M$56.47M$52.23M$34.88M$60.41M$35.73M$40.98M$37.12M$70.35M$77.14M$37.01M$56.05M$70.86M$44.62M$44.43M$39.27M$56.47M
4Canada7.82%$15.06M$14.92M$11.84M$16.55M$14.66M$16.52M$20.68M$16.97M$18.14M$17.90M$19.54M$17.85M$17.68M$14.39M$13.15M$14.80M$19.02M$20.12M$18.45M$20.17M$19.88M$19.93M$20.09M$19.31M$15.70M$14.20M$12.96M$13.68M$13.87M$15.10M$16.98M$15.71M
5Netherlands2.68%$5.31M$5.09M$4.96M$5.31M$5.84M$4.38M$5.95M$7.15M$5.35M$4.92M$5.27M$4.23M$5.07M$4.08M$3.83M$5.39M$4.83M$4.96M$4.71M$6.59M$6.75M$5.68M$7.68M$5.57M$6.30M$5.35M$4.51M$5.39M$5.36M$6.15M$4.77M$4.05M
6Germany1.75%$3.40M$3.14M$2.39M$2.39M$2.83M$3.51M$3.28M$3.72M$3.30M$3.11M$3.67M$2.59M$2.45M$2.19M$1.90M$3.23M$4.19M$4.06M$4.92M$4.72M$3.79M$4.97M$4.96M$4.57M$3.66M$3.43M$3.27M$2.90M$3.12M$3.11M$3.71M$2.79M
7Chile0.46%$602.02K$1.59M$1.66M$1.42M$633.23K$1.29M$1.05M$544.39K$1.50M$705.08K$566.01K$575.81K$874.70K$1.38M$1.26M$1.46M$981.78K$721.19K$1.60M$1.06M$675.43K$941.74K$855.47K$961.32K$1.05M$1.05M$934.61K$1.01M$1.48M$642.05K-$801.17K
8Poland0.38%$616.37K$443.96K$549.72K$504.08K$730.40K$646.11K$611.47K$698.23K$615.28K$638.33K$675.10K$676.43K$1.11M$528.38K$429.13K$534.46K$1.32M$2.09M$1.20M$1.04M$1.14M$896.86K$1.00M$1.09M$701.83K$726.72K$547.96K$520.50K$844.92K$803.39K$798.39K$397.81K
9Czechia0.36%$225.39K$236.75K$482.04K$295.71K$251.01K$554.81K$160.25K$237.33K$242.21K$486.85K$362.22K$227.10K$273.76K$150.49K$99.77K$302.12K$336.09K$314.53K$259.80K$343.88K$528.00K$449.57K$562.93K$980.20K$689.89K$772.04K$598.66K$2.31M$658.07K$711.78K$479.97K$387.55K
10South Africa0.3%$1.63M$1.80M$999.94K$423.54K$953.45K$1.48M$4.74M$4.28M$1.95M$3.06M$2.48M$798.73K$1.49M$1.17M$1.35M$196.70K$819.77K$2.21M$3.33M$2.37M$3.01M$1.61M$578.12K$443.50K$220.37K$330.40K$176.31K$192.47K$356.28K$536.67K$274.44K$103.73K

Share of Top Exporting Countries

Discover the share of top 10 exporting countries of Lupin in 2023.
NORTH AMERICA
OCEANIA
EUROPE
SOUTH AMERICA
AFRICA
OTHERS

Are you sourcing for Lupin?

Discover Lupin premium suppliers on Tridge. Contact suppliers that you are interested in and start receiving offers. Learn more about finding suppliers.

Explore More Through Our Services

Our Solution

Data & Analytics

Access actionable agri-food data and gain a deep understanding of global market dynamics and trends to enhance your business efficiency.
Our Solution

Insights

Keep track of the latest events and issues happening around the world through our in-depth contents and curation of relevant news.
Our Solution

Find Suppliers

Connect and engage with thousands of credible agri-food suppliers worldwide. Browse through their products and connect with them in real-time.
Our Solution

Find Buyers

Discover reliable buyers looking for your products and establish long-term relationships. Respond to their RFQs with your quotes.
image
Who We Are

The leading global sourcing hub of food & agriculture

We provide solutions to help you not only understand the global market of food and agriculture, but also start importing products that you need right away.
By clicking “Accept Cookies,” I agree to provide cookies for statistical and personalized preference purposes. To learn more about our cookies, please read our Privacy Policy.