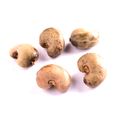
Raw Cashew Nut

Raw Cashew Nut

HS Code: 080131 - Nuts, edible; cashew nuts, fresh or dried, in shell
Market:
Top Exporter
2022
TZ flagTanzania
Top Importer
2022
IN flagIndia
Export Value
2022
354.96MUSD
1Y -50.74%
Import Value
2022
1.93BUSD
1Y -59.73%

Import of Raw Cashew Nut

Discover import data of Raw Cashew Nut. Get import value, price data, trends, and more. The information below is based on the HS code 080131 (Nuts, edible; cashew nuts, fresh or dried, in shell).

Import Trends Overview of Top 10 Importers

See the import trends of top 10 countries that have the highest import values.
IN flagIndia
Rank 1
$1.9B
1y
+67.44%
3y
+71.80%
5y
+29.94%
BR flagBrazil
Rank 2
$17.6M
1y
-
3y
+319.99%
5y
-55.57%
CN flagChina
Rank 3
$11.1M
1y
-12.48%
3y
-40.19%
5y
-4.91%
BE flagBelgium
Rank 4
$3.1M
1y
-24.06%
3y
-14.43%
5y
-42.91%
CA flagCanada
Rank 5
$2.0M
1y
+143.24%
3y
+131.91%
5y
-51.22%
DK flagDenmark
Rank 6
$1.4M
1y
+33.56%
3y
+339.56%
5y
+648.11%
US flagUnited States
Rank 7
$1.0M
1y
-31.21%
3y
-21.56%
5y
-61.33%
LB flagLebanon
Rank 8
$925.4K
1y
+334.73%
3y
+1443.61%
5y
+580.17%
ZA flagSouth Africa
Rank 9
$888.8K
1y
+75.30%
3y
+210.65%
5y
-65.84%
FI flagFinland
Rank 10
$743.6K
1y
+155.41%
3y
+641.76%
5y
+45.23%

Trends of Top 10 Importers

This is the import trends of the top 10 importers of Raw Cashew Nut from 2015 to 2022.
Country
Import %
Import Value
20/11
20/12
21/01
21/02
21/03
21/04
21/05
21/06
21/07
21/08
21/09
21/10
21/11
21/12
22/01
22/02
22/03
22/04
22/05
22/06
22/07
22/08
22/09
22/10
22/11
22/12
23/01
23/02
23/03
23/04
23/05
23/06
1Global$195.17M$220.07M$182.48M$194.13M$784.96M$830.57M$467.74M$526.23M$499.71M$308.97M$359.34M$243.79M$179.05M$196.83M$56.08M$117.19M$85.04M$107.16M$145.20M$340.23M$347.60M$269.06M$227.76M$115.68M$73.96M$39.10M$66.86M$43.77M$54.29M$104.12M$194.11M$2.21K
2India97.7%$81.49M$63.77M$40.73M$37.40M$71.45M$92.53M$109.72M$195.82M$138.92M$81.98M$125.27M$75.88M$66.00M$89.73M$54.71M$115.12M$83.71M$106.19M$143.86M$317.53M$344.39M$266.03M$225.33M$113.91M$72.98M$37.58M$65.98M$42.96M$53.55M$103.73M$193.97M-
3Brazil0.91%-------------------$17.57M------------
4China0.58%$957.23K$317.91K$548.05K$53.20K$50.15K$67.08K$843.27K$3.44M$2.11M$2.32M$1.47M$442.29K$477.95K$872.18K$194.59K$14.89K$29.49K$45.19K$243.93K$4.24M$2.05M$1.83M$1.44M$440.22K-$579.26K------
5Belgium0.16%$418.60K$287.48K$409.25K$354.33K$549.17K$380.43K$313.24K$325.83K$298.05K$310.64K$421.94K$145.81K$350.42K$271.89K$146.05K$638.71K$269.46K$225.31K$168.01K$213.06K$273.47K$112.27K$329.78K$131.48K$379.82K$262.51K$202.81K$153.26K$251.86K$202.80K--
6Canada0.1%$1.16K$73.60K$11.15K$5.20K$268.49K$84.86K$72.77K$23.14K$9.60K$1.95K$88.49K$188.03K$1.89K$75.61K$84.62K$388.36K$234.78K$92.07K$95.56K$92.37K$186.37K$173.82K$106.63K$228.96K$182.22K$151.34K$318.91K$214.26K$782.00$697.00$8.71K-
7Denmark0.07%$26.90K$5.97K$14.49K$134.29K$285.33K$20.57K$33.34K$19.59K$12.49K$112.05K$89.53K$117.70K$7.97K$117.76K$149.48K$126.56K$195.39K$289.74K$51.70K$74.23K$109.85K$80.23K$92.35K$169.20K$15.07K$83.42K$167.08K$183.45K$109.56K$62.99K$106.81K-
8United States0.05%$132.40K$264.10K$295.78K-$181.48K-$13.61K$132.60K-$136.00K$268.20K$298.85K-$146.00K-$170.05K$29.45K-$137.80K-$149.10K-$141.07K$130.20K$136.92K$118.40K$15.96K$120.20K$122.40K$4.36K--
9Lebanon0.05%--------------------------------
10South Africa0.05%$109.70K--$74.00$3.54K-$12.00$88.32K$89.95K$3.77K$0.00$97.92K$102.79K$113.25K$229.15K$300.00$3.66K$250.00--$2.19K$641.75K$9.11K$428.00$90.00$35.00-$8.00$503.00-$102.00-

Top Import Flows

Discover the top import flows of Raw Cashew Nut in 2022. The top import flow in 2022 was from India to Ivory Coast, with an import value of USD 349M.

Share of Top Importing Countries

Discover the share of top 10 importing countries of Raw Cashew Nut in 2022.

Are you sourcing for Raw Cashew Nut?

Discover Raw Cashew Nut premium suppliers on Tridge. Contact suppliers that you are interested in and start receiving offers. Learn more about our Social Marketplace.

Explore More Through Our Services

Our Solution

Social Marketplace

Connect and engage with players in the agri-food industry in Tridge Social Marketplace. Build long-term relationships founded on trust.
Our Solution

Data & Analytics

Access actionable agri-food data and gain a deep understanding of global market dynamics and trends to enhance your business efficiency.
Our Solution

Insights

Keep track of the latest events and issues happening around the world through our in-depth contents and curation of relevant news.
Our Solution

Fulfillment Solution

Source food and agricultural products efficiently from over 70 countries. We take care of everything from production to shipment for you.

Ready to list your business?

Build brand awareness and maximize your business potential by joining Social Marketplace as a supplier and effortlessly connect with potential buyers worldwide.
imageimage
Who We Are

The leading global sourcing hub of food & agriculture

We provide solutions to help you not only understand the global market of food and agriculture, but also start importing products that you need right away.
By clicking “Accept Cookies,” I agree to provide cookies for statistical and personalized preference purposes. To learn more about our cookies, please read our Privacy Policy.