
Derived Products
Sorghum Flour, Sorghum Meal, Sorghum Starch, Gluten-Free Lager
HS Code
100790
Last Updated
2026-07-29
Key takeaways for search and sourcing teams
- Sorghum Grain market coverage spans 133 countries.
- 1,425 exporter companies and 1,441 importer companies are indexed in the global supply chain intelligence network for this product.
- 4,675 supplier-linked transactions are summarized across the top 20 countries.
- 8 premium suppliers and 1 catalog items are currently listed.
- Wholesale sample entries: 5; farmgate sample entries: 2.
- Latest reference year in this page dataset is 2026.
- Page data last updated on 2026-07-29.
Global Supplier Transactions, Export Activity, and Price Benchmarks for Sorghum Grain
Analyze 4,675 supplier-linked transactions across the top 20 countries, with monthly unit-price benchmarks to track export competitiveness and sourcing risk for Sorghum Grain.
Sorghum Grain Country YoY Change in Supplier Transactions and Export Momentum
Compare positive and negative YoY shifts in Sorghum Grain to identify accelerating supplier markets and weakening export corridors.
Top YoY shifts for Sorghum Grain: Malawi (+1680.9%), South Africa (+414.8%), United Arab Emirates (+318.7%).
Sorghum Grain Country-Level Supplier Transaction and Unit Price Summary
As of 2025-08, benchmark Sorghum Grain country transaction counts with monthly unit price and volume to prioritize supplier and export markets.
In 2026-01, countries with visible Sorghum Grain transaction unit prices: United Arab Emirates (12.30 USD / kg), Brazil (5.02 USD / kg), France (3.84 USD / kg), United States (3.64 USD / kg), Vietnam (3.62 USD / kg), 9 more countries.
| Country | YoY Change | Transaction Count | 2025-08 | 2025-09 | 2025-10 | 2025-11 | 2025-12 | 2026-01 | 2026-02 | 2026-03 | 2026-04 | 2026-05 | 2026-06 | 2026-07 |
|---|---|---|---|---|---|---|---|---|---|---|---|---|---|---|
| China | +29.5% | 72 | 0.62 USD / kg (60,000 kg) | 1.04 USD / kg (370,012 kg) | 1.10 USD / kg (195,334 kg) | 0.98 USD / kg (410,726 kg) | 1.42 USD / kg (308,305 kg) | 1.82 USD / kg (64,468 kg) | ||||||
| India | -1.3% | 1,620 | 0.40 USD / kg (2,408,934.161 kg) | 0.36 USD / kg (5,854,084.381 kg) | 0.39 USD / kg (3,431,728.102 kg) | 0.40 USD / kg (5,444,862.089 kg) | 0.38 USD / kg (3,546,909.866 kg) | 0.42 USD / kg (5,123,433.082 kg) | ||||||
| Ukraine | +43.4% | 174 | 0.45 USD / kg (125,920 kg) | 0.31 USD / kg (-) | 0.29 USD / kg (1,824,520 kg) | 0.30 USD / kg (1,785,455 kg) | 0.28 USD / kg (1,317,795 kg) | - (-) | ||||||
| Australia | +2.6% | 152 | 0.27 USD / kg (3,106,570 kg) | 0.30 USD / kg (6,981,040 kg) | 0.30 USD / kg (5,858,480 kg) | 0.29 USD / kg (9,084,150 kg) | 0.34 USD / kg (3,318,140 kg) | 0.28 USD / kg (3,480,190 kg) | ||||||
| Mexico | -37.3% | 91 | - (-) | 0.70 USD / kg (735,196.6 kg) | 0.37 USD / kg (244,506.55 kg) | 1.51 USD / kg (868.31 kg) | 2.03 USD / kg (120,360 kg) | 1.15 USD / kg (270,630.82 kg) | ||||||
| Paraguay | -0.8% | 11 | 0.16 USD / kg (2,200,000 kg) | - (-) | 0.14 USD / kg (1,500,000 kg) | - (-) | 0.14 USD / kg (1,500,000 kg) | - (-) | ||||||
| Argentina | -11.1% | 560 | 0.21 USD / kg (659,258,237.126 kg) | 0.82 USD / kg (93,531,719.395 kg) | 1.29 USD / kg (90,418,025.755 kg) | 0.28 USD / kg (341,442,184.92 kg) | 0.21 USD / kg (420,881,449.593 kg) | 1.66 USD / kg (1,632,819.5 kg) | ||||||
| United States | +162.5% | 1,044 | 0.21 USD / kg (92,222,295.534 kg) | 0.30 USD / kg (154,414,987.168 kg) | 0.20 USD / kg (114,993,191.38 kg) | 0.45 USD / kg (62,598,171.18 kg) | 0.26 USD / kg (78,413,440.232 kg) | 3.64 USD / kg (20,014 kg) | ||||||
| Brazil | -24.4% | 106 | 20.62 USD / kg (820 kg) | 3.62 USD / kg (-) | 4.68 USD / kg (311,284.96 kg) | 4.77 USD / kg (170,870.18 kg) | 5.64 USD / kg (450,183.844 kg) | 5.02 USD / kg (93,367 kg) | ||||||
| Uruguay | -27.7% | 23 | 7.64 USD / kg (1,702,740 kg) | - (-) | 5.08 USD / kg (50,900 kg) | 1.23 USD / kg (75,000 kg) | 1.22 USD / kg (25,000 kg) | - (-) |
Sorghum Grain Global Supply Chain Coverage
2,866 companies
1,425 exporters and 1,441 importers are mapped for Sorghum Grain.
Exporters and importers can use Tridge Supply Chain Intelligence company profiles and analytics to identify counterparties for Sorghum Grain, benchmark reach, and prioritize outreach by market.
Sorghum Grain Export Supplier Intelligence, Trade Flows, and Price Signals
1,425 exporter companies are mapped in Tridge Supply Chain Intelligence for Sorghum Grain. Exporters and importers can use company profiles and analytics to evaluate supplier coverage, trading activity, and route opportunities.
Sorghum Grain Verified Export Suppliers and Premium Partners
8 premium Sorghum Grain suppliers include country, industry, and contactability signals to prioritize credible export partners faster.
AP Grand Edge Nig. Ltd
Nigeria
Contact
Food Wholesalers
JR Spices & Seeds
India
Food Manufacturing
Davis Trade & Commodities
United States
Brokers And Trade Agencies
KORE INTERNATIONAL
India
Food ManufacturingFood WholesalersBrokers And Trade Agencies
Gum Arabic Company Nigeria Limited
Nigeria
ContactCatalog
Crop ProductionFood ManufacturingBeverage ManufacturingFood Packaging
Savaliya Agri Commodity Export Pvt. Ltd.
India
Crop ProductionFood ManufacturingBrokers And Trade Agencies
National Cooperative Exports Limited
India
Food ManufacturingFood PackagingOthers
ANKO AGROTRADE SA
Switzerland
Food ManufacturingCrop Production
Become a Premium Supplier to join the Tridge Supply Chain Network and advance your marketing and export channel strategy.
Sorghum Grain Global Supplier Catalog Offers and Export Pricing Opportunities
Compare 1 Sorghum Grain supplier listings by origin, Incoterms, minimum volume, and offer price to identify export-ready sourcing opportunities.
Sorghum Grain Top Exporters and Supplier Profiles
Review leading exporter profiles while benchmarking against 1,425 total exporter companies in the Sorghum Grain supply chain intelligence network. Exporters and importers can unlock company profiles and analytics to qualify partners faster.
(Ukraine)
Latest Export Transaction: 2026-06-29
Recently Export Partner Companies: 1
Industries: Others
Value Chain Roles: Trade
(India)
Latest Export Transaction: 2026-02-19
Recently Export Partner Companies: 1
Industries: Crop Production
Value Chain Roles: Farming / Production / Processing / Packing
(Uganda)
Latest Export Transaction: 2026-06-29
Recently Export Partner Companies: 1
Industries: Brokers And Trade AgenciesFood ManufacturingFood Packaging
Value Chain Roles: Distribution / WholesaleFarming / Production / Processing / PackingTrade
(Botswana)
Latest Export Transaction: 2026-06-29
Recently Export Partner Companies: 1
Employee Size: Over 1000 Employees
Sales Revenue: USD Over 1B
Industries: Food WholesalersFreight Forwarding And IntermodalOthers
Value Chain Roles: Distribution / WholesaleLogistics
(Bolivia)
Latest Export Transaction: 2026-06-29
Recently Export Partner Companies: 1
Industries: Others
Value Chain Roles: Trade
(United States)
Latest Export Transaction: 2026-06-29
Recently Export Partner Companies: 1
Employee Size: 11 - 50 Employees
Sales Revenue: USD 5M - 10M
Industries: Crop ProductionFood ManufacturingFood Services And Drinking Places
Value Chain Roles: Distribution / WholesaleFarming / Production / Processing / PackingFood Manufacturing
Sorghum Grain Global Exporter Coverage
1,425 companies
Exporter company count is a key signal for Sorghum Grain supply depth and sourcing optionality.
Use Supply Chain Intelligence analytics to narrow Sorghum Grain opportunities by country, product, and value-chain role, then open company profiles to validate fit.
Top Exporting Countries for Sorghum Grain (HS Code 100790) in 2024
For Sorghum Grain in 2024, compare export volume and value across the top 10 supplier countries to map core supply structure.
| Rank | Country | Volume | Value |
|---|---|---|---|
| 1 | United States | 5,362,346,000 kg | 1,413,451,226 USD |
| 2 | Australia | 2,215,676,270 kg | 627,114,034.349 USD |
| 3 | Argentina | 1,102,291,000 kg | 242,000,964.95 USD |
| 4 | Brazil | 178,443,890 kg | 35,198,480 USD |
| 5 | Hungary | 98,820,800 kg | 19,485,065 USD |
| 6 | Ukraine | 81,785,426 kg | 15,558,000.29 USD |
| 7 | India | 21,234,120 kg | 8,897,590.348 USD |
| 8 | Uzbekistan | 1,705,110.498 kg | 6,846,051.98 USD |
| 9 | Paraguay | 39,528,000 kg | 5,829,896 USD |
| 10 | Netherlands | 2,837,324 kg | 2,102,160.364 USD |
Sorghum Grain Export Trade Flow and Partner Country Summary
Track Sorghum Grain exporter-to-importer flows by value, volume, and share to uncover high-potential export routes.
Sorghum Grain Import Buyer Intelligence, Demand Signals, and Price Benchmarks
1,441 importer companies are mapped for Sorghum Grain demand intelligence. Use Supply Chain Intelligence company profiles and analytics to prioritize buyers, distributors, and downstream demand partners by market.
Sorghum Grain Top Buyers, Importers, and Demand Partners
Review leading buyer profiles and compare them against 1,441 total importer companies tracked for Sorghum Grain. Exporters and importers can use Supply Chain Intelligence company profiles and analytics to evaluate buyer quality and demand concentration.
(Uganda)
Latest Import Transaction: 2026-06-29
Recently Import Partner Companies: 1
Industries: Food ManufacturingFood Services And Drinking PlacesFood Wholesalers
Value Chain Roles: -
(Argentina)
Latest Import Transaction: 2026-04-13
Recently Import Partner Companies: 7
Employee Size: 51 - 100 Employees
Sales Revenue: USD 5M - 10M
Industries: Crop ProductionFood ManufacturingFood Packaging
Value Chain Roles: -
(Botswana)
Latest Import Transaction: 2026-06-29
Recently Import Partner Companies: 1
Industries: Brokers And Trade AgenciesFood WholesalersOthers
Value Chain Roles: -
(Kenya)
Latest Import Transaction: 2026-06-29
Recently Import Partner Companies: 2
Industries: Others
Value Chain Roles: -
(Kenya)
Latest Import Transaction: 2026-06-29
Recently Import Partner Companies: 1
Industries: Food Wholesalers
Value Chain Roles: -
(Poland)
Latest Import Transaction: 2026-02-16
Recently Import Partner Companies: 1
Industries: Others
Value Chain Roles: -
Global Importer Coverage
1,441 companies
Importer company count highlights the current depth of demand-side visibility for Sorghum Grain.
Use Supply Chain Intelligence analytics and company profiles to identify active Sorghum Grain buyers, compare partner density by country, and refine GTM priorities.
Top Import Demand Countries for Sorghum Grain (HS Code 100790) in 2024
For Sorghum Grain in 2024, compare import volume and value across the top 10 demand countries to identify priority markets.
| Rank | Country | Volume | Value |
|---|---|---|---|
| 1 | Japan | 121,963,000 kg | 39,700,743.714 USD |
| 2 | Italy | 94,681,736 kg | 18,688,245.725 USD |
| 3 | Spain | 61,967,122 kg | 13,695,075.876 USD |
| 4 | Philippines | 18,705,711 kg | 6,692,204 USD |
| 5 | Brazil | 34,619,000 kg | 5,468,491 USD |
| 6 | Belgium | 16,933,227.7 kg | 4,936,047.91 USD |
| 7 | Israel | 15,592,375.442 kg | 4,224,000 USD |
| 8 | United Kingdom | 10,327,660 kg | 3,539,411.287 USD |
| 9 | Poland | 12,819,941 kg | 3,062,884 USD |
| 10 | Zimbabwe | 4,207,680 kg | 2,749,457.689 USD |
Sorghum Grain Import Trade Flow and Origin Country Summary
Analyze Sorghum Grain origin-to-destination trade flows by value, volume, and share to monitor demand-side sourcing channels.
Global Wholesale Supplier Price Trends by Country for Sorghum Grain
Sorghum Grain Monthly Wholesale Supplier Price Summary by Country
Monthly Sorghum Grain wholesale unit-price benchmarks by country for export and sourcing decisions.
In 2026-01, countries with visible Sorghum Grain wholesale unit prices: Nigeria (0.75 USD / kg), Ethiopia (0.48 USD / kg), India (0.37 USD / kg).
| Country | 2025-08 | 2025-09 | 2025-10 | 2025-11 | 2025-12 | 2026-01 | 2026-02 | 2026-03 | 2026-04 | 2026-05 | 2026-06 | 2026-07 |
|---|---|---|---|---|---|---|---|---|---|---|---|---|
| India | 0.31 USD / kg | 0.30 USD / kg | 0.30 USD / kg | 0.34 USD / kg | 0.36 USD / kg | 0.37 USD / kg | ||||||
| Nigeria | 0.60 USD / kg | 0.58 USD / kg | 0.68 USD / kg | 0.86 USD / kg | 0.75 USD / kg | 0.75 USD / kg | ||||||
| Ethiopia | - | 0.50 USD / kg | 0.51 USD / kg | - | 0.48 USD / kg | 0.48 USD / kg | ||||||
| Sudan | - | 1.44 USD / kg | - | - | - | - | ||||||
| Tanzania | - | - | - | - | - | - |
Sorghum Grain Wholesale Price Competitiveness by Major Exporting Countries
Compare Sorghum Grain wholesale price ranges and YoY changes across the top 5 exporting countries to benchmark supplier price competitiveness.
Latest Sorghum Grain Wholesale Export Price Updates
Use the latest 5 Sorghum Grain wholesale updates to validate current export price points and origin-level supplier changes.
| Date | Entry Name | Unit Price (USD) | |
|---|---|---|---|
| 2026-07-01 | Jow***************** ******* * * ************ *********** ******* **************** **** | 0.24 USD / kg | |
| 2026-07-01 | Jow***************** * ****** ***** * * ************ *********** ****** **** | 0.23 USD / kg | |
| 2026-07-01 | Jow***************** * ****** ***** * * ************ ******* *********** **** | 0.53 USD / kg | |
| 2026-07-01 | Jow***************** ******* * * ************ *********** ****** **** | 0.36 USD / kg | |
| 2026-07-01 | Jow*********** * ************ ************* | 24.50 USD / kg |
Global Farmgate Supplier Price Trends by Country for Sorghum Grain
Sorghum Grain Monthly Farmgate Supplier Price Summary by Country
Monthly Sorghum Grain farmgate unit-price benchmarks by country to monitor supplier-side cost movement.
In 2026-01, countries with visible Sorghum Grain farmgate unit prices: Hungary (210.65 USD / kg).
| Country | 2025-08 | 2025-09 | 2025-10 | 2025-11 | 2025-12 | 2026-01 | 2026-02 | 2026-03 | 2026-04 | 2026-05 | 2026-06 | 2026-07 |
|---|---|---|---|---|---|---|---|---|---|---|---|---|
| Hungary | 207.09 USD / kg | 210.90 USD / kg | 203.12 USD / kg | 200.86 USD / kg | 205.39 USD / kg | 210.65 USD / kg |
Sorghum Grain Farmgate Cost Trends by Major Exporting Supplier Countries
Compare Sorghum Grain farmgate price levels and YoY changes across the top 1 exporting countries to understand origin-side supplier cost structure.
| Rank | Country | Average | Lower | Upper | YoY |
|---|---|---|---|---|---|
| 1 | Hungary | 205.49 USD / kg | 191.71 USD / kg | 215.17 USD / kg | +12.4% |
Latest Sorghum Grain Farmgate Export Cost Updates
Review the latest 2 Sorghum Grain farmgate updates to monitor origin-side export cost and supplier pricing shifts.
| Date | Entry Name | Unit Price (USD) | |
|---|---|---|---|
| 2026-04-01 | Sor**** ***** ******** * *** * | 194.74 USD / kg | |
| 2025-04-01 | Sor**** ***** * * *** ******** | 375.00 USD / kg |
Classification
Product TypeRaw Material
Product FormDried Grain
Industry PositionPrimary Agricultural Product
Raw Material
Commodity GroupCereal (coarse grain)
Scientific NameSorghum bicolor (L.) Moench
PerishabilityLow
Growing Conditions
- Warm-season cereal; many high-yielding types perform best at temperatures above ~25°C (FAO Land & Water)
- Adapted to semi-arid and tropical climates; widely grown under rainfed conditions with drought-resistance traits (FAO Land & Water; ICRISAT)
- Grown on a range of soils including lower-fertility dryland environments, with performance strongly influenced by rainfall timing and heat stress (ICRISAT)
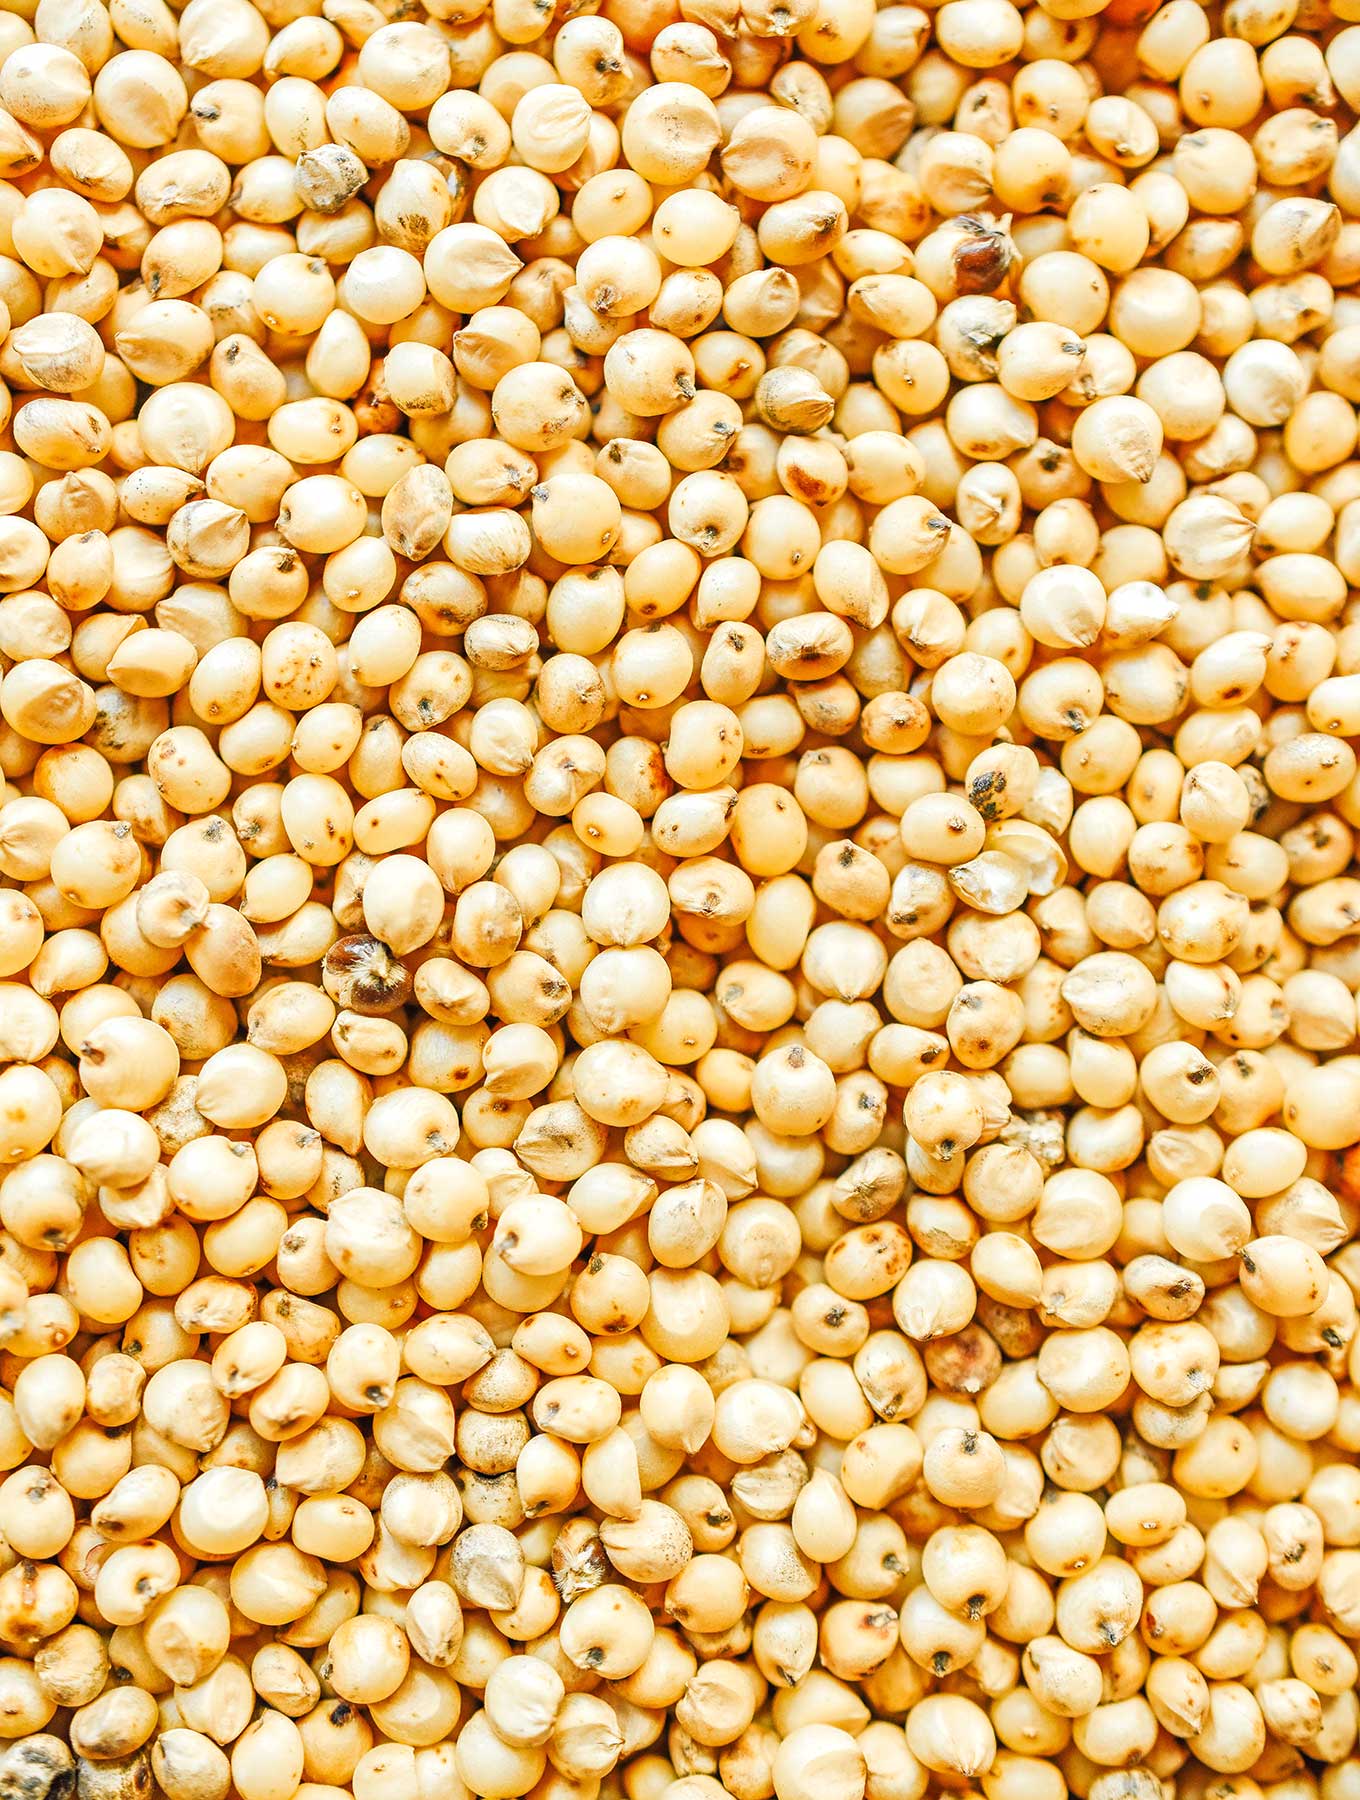
Main VarietiesWhite-grain sorghum, Red-grain sorghum, Brown-grain sorghum, Low-tannin types, High-tannin types
Consumption Forms
- Whole grain and decorticated grain for human food uses (Codex CXS 172-1989)
- Milled products (e.g., flour/meal) for porridges, flatbreads, and traditional foods (ICRISAT)
- Animal feed grain (ICRISAT)
- Brewing and industrial uses including biofuel-related applications in some markets (ICRISAT)
Grading Factors
- Moisture content (Codex maximum 14.5% m/m for food-use sorghum) (Codex CXS 172-1989)
- Total defects tolerance framework including broken kernels, blemished/diseased grains, and other grains (Codex CXS 172-1989)
- Extraneous matter and inorganic matter limits (Codex CXS 172-1989)
- Absence of abnormal odors/flavors and living insects (Codex CXS 172-1989)
- Tannin content limits for whole vs decorticated grains (Codex CXS 172-1989)
Planting to HarvestOften a short-duration annual crop; short-duration sorghum types are commonly described around ~115–120 days (~4 months) in agronomic guidance (ICRISAT).
Market
Grain sorghum (commonly traded under HS 1007/100700) is a coarse cereal with dual significance as a staple food grain in parts of Africa and South Asia and as a globally traded feed grain. Global production is concentrated in a mix of large-scale commercial systems (notably the United States) and smallholder rainfed systems (notably in the Sahel and Horn of Africa). International trade is highly demand-concentrated: in 2024 China accounted for the vast majority of global sorghum import value, making trade flows and prices sensitive to Chinese feed and trade policy shifts. On the export side, a small set of origins—especially the United States and Australia—drive most globally traded volumes, with Argentina also a major supplier.
Market GrowthMixed (2020–2024 trade-value context)volatile year-to-year trade values with demand-driven swings
Major Producing Countries
- United StatesAmong the largest producers; major export-oriented origin (FAOSTAT; USDA FAS PS&D/Crop Explorer).
- NigeriaAmong the largest producers; predominantly domestically consumed as a staple grain (FAOSTAT; ICRISAT).
- SudanMajor producer in Africa; significant domestic food-security relevance (FAOSTAT; ICRISAT).
- MexicoSignificant producer in the Americas; used in domestic feed systems and regional trade (FAOSTAT).
- EthiopiaMajor producer and consumer; sorghum is an important staple cereal (FAOSTAT; ICRISAT).
- IndiaMajor producer and consumer (jowar); primarily domestically used (FAOSTAT; ICRISAT).
Major Exporting Countries
- United StatesLargest exporter by value and volume in 2024 (UN Comtrade via WITS).
- AustraliaSecond-largest exporter by value and volume in 2024 (UN Comtrade via WITS).
- ArgentinaMajor exporter in 2024 (UN Comtrade via WITS).
- FranceNotable exporter in 2024 (UN Comtrade via WITS).
- BrazilNotable exporter in 2024 (UN Comtrade via WITS).
Major Importing Countries
- ChinaDominant global importer in 2024 by value and quantity; import share ~84% of world import value (ITC Trade Map).
- EthiopiaNotable importer by value and quantity in 2024 (ITC Trade Map).
- JapanNotable importer by value and quantity in 2024 (ITC Trade Map).
- SudanNotable importer by value and quantity in 2024 (ITC Trade Map).
- EritreaNotable importer by value and quantity in 2024 (ITC Trade Map).
- South AfricaNotable importer by value and quantity in 2024 (ITC Trade Map).
Specification
Major VarietiesWhite sorghum (food-focused types), Red sorghum, Brown sorghum, Low-tannin sorghum, High-tannin sorghum
Physical Attributes
- Small round kernels with a tight outer seed coat; grain color varies from white to red/brown depending on genotype and market segment
- Whole grain or decorticated (partially dehulled/degermed) forms are traded for food use (Codex CXS 172-1989)
Compositional Metrics
- Moisture content: 14.5% m/m maximum (Codex CXS 172-1989)
- Tannin content maximums: 0.5% (whole) and 0.3% (decorticated) on a dry matter basis (Codex CXS 172-1989)
Grades
- Whole sorghum grains (Codex CXS 172-1989)
- Decorticated sorghum grains (Codex CXS 172-1989)
- Defect-based tolerance conventions for extraneous matter, broken kernels, filth, and total defects (Codex CXS 172-1989)
Packaging
- Bulk shipments via inland grain handling systems to export terminals (rail/truck/barge depending on origin)
- Sacks/bags and other containers are used for smaller food-grade lots; packaging should safeguard hygienic and technological quality (Codex CXS 172-1989)
Supply Chain
Value Chain
- Harvest → drying (as needed) → cleaning/grading → silo storage → inland logistics to port → bulk vessel/container export → import terminal storage → milling/decortication or feed compounding
Demand Drivers
- Feed-grain demand and substitution versus maize/barley in importing markets, with China a dominant import market in recent years (ITC Trade Map; UN Comtrade via WITS)
- Staple-food demand in parts of Africa and South Asia where sorghum is a key cereal (ICRISAT)
- Industrial uses including brewing and biofuel applications in some markets (ICRISAT)
Temperature
- Primary quality protection is moisture control rather than refrigeration; Codex specifies 14.5% maximum moisture for sorghum grains for food use (Codex CXS 172-1989)
- Warm, humid storage conditions increase risks of insect infestation and mold; aeration and dry storage management are common mitigations in commercial grain systems
Shelf Life
- Long shelf life under dry, clean storage conditions; storage risk increases when moisture rises above buyer/spec limits (Codex CXS 172-1989 moisture guidance).
Risks
Demand Concentration HighGlobal sorghum trade is highly exposed to a single import market: in 2024 China represented ~83.8% of world grain sorghum import value and the vast majority of import tonnage. Policy changes, substitution away from sorghum in feed rations, or trade restrictions affecting China can rapidly reprice the global market and strand exportable supply in major origins.Maintain multi-market sales optionality (food-grade, industrial, and diversified feed destinations), monitor China import policy and feed-grain substitution signals, and structure contracts/logistics to pivot between destinations when demand shifts.
Climate MediumSorghum is drought-tolerant relative to some cereals, but production in key regions remains sensitive to extreme heat and rainfall variability, particularly in rainfed semi-arid systems. Poor seasons can tighten local availability in food-staple regions and increase reliance on imports in deficit countries.Use diversified origin portfolios across hemispheres, track seasonal precipitation/heat outlooks in major producing belts, and consider blending strategies and inventory buffers for food-grade programs.
Food Safety MediumQuality and safety risks are concentrated in post-harvest handling: elevated moisture and inadequate storage increase mold and pest pressure, raising risks of contamination and failing buyer defect tolerances. Codex sets explicit limits for moisture and defect categories for sorghum grains intended for human consumption.Enforce inbound moisture and defect specifications (Codex-aligned), require documented storage controls (drying/aeration, pest management), and apply lot-level testing where required by destination regulations.
Regulatory Compliance LowFood-use sorghum traded internationally may be screened against Codex-aligned tolerances for extraneous matter, filth, and tannin content, and may face destination-specific contaminant and phytosanitary requirements that vary by market.Align contracts to Codex CXS 172-1989 where applicable, document cleaning/sorting controls, and confirm destination-specific import requirements prior to shipment.
Sustainability
- High climate variability exposure in major rainfed sorghum zones (semi-arid tropics), with drought/heat resilience a key sustainability and adaptation theme (FAO Land & Water; ICRISAT)
- Water management and soil conservation in dryland systems; yield stability is often constrained by erratic rainfall (FAO Land & Water; ICRISAT)
Labor & Social
- Smallholder-dominated production in many African and South Asian systems links sorghum market shocks to rural livelihoods and food security (ICRISAT)
FAQ
Which countries are the leading exporters of grain sorghum?In 2024, the United States was the largest exporter of grain sorghum, followed by Australia and Argentina, with France and Brazil also exporting notable volumes (UN Comtrade via WITS).
Why is China so important to global sorghum trade?China dominated global grain sorghum imports in 2024, accounting for about 83.8% of world import value and the majority of import tonnage, so changes in Chinese demand or trade policy can quickly reshape global trade flows and prices (ITC Trade Map).
What are key buyer quality parameters for food-use sorghum grain?Codex CXS 172-1989 specifies a maximum moisture content of 14.5% and includes defect tolerances such as limits on total defects and extraneous matter; it also sets tannin maximums of 0.5% for whole grains and 0.3% for decorticated grains (Codex CXS 172-1989).
What are the main end uses of sorghum grain globally?Sorghum grain is widely used as a staple food cereal in parts of Africa and South Asia, as a feed grain in livestock and poultry systems, and in some markets for brewing and biofuel-related applications (ICRISAT).
Sources
Sorghum Grain Country Coverage for Suppliers, Export Flows, and Prices
Explore country-level Sorghum Grain market pages for supplier coverage, trade flows, and price benchmarks.


All country market pages: China, United States, Australia, Bolivia, India, Argentina, Mexico, Nigeria, Kenya, Uganda, Ethiopia, France, Japan, Brazil, Uruguay, Sudan, South Africa, Italy, Tanzania, Paraguay, Spain, Ukraine, Zambia, Belgium, Hungary, Benin, Romania, United Arab Emirates, Burkina Faso, Botswana, Mali, Vietnam, Madagascar, Niger, Turkiye, Morocco, Poland, Israel, Ghana, Moldova, Nicaragua, Colombia, Zimbabwe, Malawi, Saudi Arabia, Uzbekistan, Philippines, Germany, Netherlands, Iraq, Egypt, Slovakia, Austria, United Kingdom, Bulgaria, Czechia, Greece, Kazakhstan, Canada, South Korea, Portugal, Angola, Myanmar [Burma], Taiwan, Belize, Iran, Bangladesh, Cameroon, Thailand, Honduras, Malaysia, Afghanistan, Armenia, Bosnia and Herzegovina, Bahrain, Burundi, Brunei, Bahamas, Bhutan, Switzerland, Ivory Coast, Chile, Costa Rica, Cuba, Djibouti, Denmark, Dominican Republic, Finland, Fiji, Gambia, Guinea, Equatorial Guinea, Guinea-Bissau, Hong Kong, Croatia, Indonesia, Ireland, Jordan, Kyrgyzstan, Cambodia, Kuwait, Sri Lanka, Liberia, Lesotho, Lithuania, Macedonia, Malta, Mauritius, Mozambique, Namibia, Norway, Nepal, New Zealand, Oman, Panama, Peru, Pakistan, Qatar, Serbia, Rwanda, Seychelles, Sweden, Singapore, Senegal, Somalia, Suriname, El Salvador, Swaziland, Togo, Tajikistan, Tunisia, Venezuela, Yemen
Related Sorghum Grain Product Categories
Browse parent, sub, derived, and raw-material product market pages related to Sorghum Grain.
By clicking “Accept Cookies,” I agree to provide cookies for statistical and personalized preference purposes. To learn more about our cookies, please read our Privacy Policy.