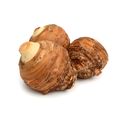
토란

토란

HS Code: 071440 - Vegetable roots and tubers; taro (Colocasia spp.) with high starch or inulin content, fresh, chilled, frozen or dried, whether or not sliced or in the form of pellets
|
FAO Code: 0136 - Taro
Market:
Top Exporter
2023
Top Importer
2023
Top Producer
2023
Export Value
2023
182MUSD
1Y +17.78%
Import Value
2023
235.55MUSD
1Y +17.87%
Production Volume
2023
18.64BKG
1Y -6.99%

Production of 토란

Discover production data of 토란. Get production volume, price data, trends, and more. The information below is based on the FAO code 0136 (Taro).

Related Market Brief Curations

Discover curated market data on production for 토란.

Production Trends Overview of Top 10 Countries

In 2023, 나이지리아 was the largest producer of 토란, followed by 카메룬, 중국, 에티오피아, 가나, 파푸아뉴기니, 마다가스카르, 르완다, 이집트, 중앙아프리카 공화국. This ranking is based on available production data and may exclude countries with missing records.
8.3B kg
1y
+1.64%
3y
+5.94%
5y
+5.09%
Rank 2
1.9B kg
1y
+0.86%
3y
+13.73%
5y
+6.79%
Rank 3
1.9B kg
1y
+0.29%
3y
-1.09%
5y
+2.45%
1.9B kg
1y
+22.12%
3y
-18.83%
5y
+18.95%
Rank 5
1.7B kg
1y
+0.84%
3y
+7.34%
5y
+17.27%
277.0M kg
1y
+0.25%
3y
+0.14%
5y
+2.26%
229.8M kg
1y
-0.21%
3y
-0.64%
5y
-1.79%
Rank 8
191.9M kg
1y
-5.41%
3y
+2.06%
5y
+14.25%
Rank 9
178.1M kg
1y
+0.18%
3y
+33.42%
5y
+47.59%
141.8M kg
1y
-0.46%
3y
+0.67%
5y
+0.62%

Trends of Top 10 Producers

This is the production trends of the top 10 producers of 토란 from 2009 to 2023.
CountryProduction %Production Volume
200920102011201220132014201520162017201820192020202120222023
1Global18.61B18.27B18.50B17.64B16.49B14.19B12.33B17.82B18.82B20.95B20.61B21.92B21.51B20.04B18.64B
2나이지리아46.22%3.03B2.96B3.01B3.06B3.06B3.27B3.28B7.15B7.55B7.93B7.90B7.87B8.20B8.20B8.33B
3카메룬10.62%1.45B1.47B1.57B1.61B1.55B1.70B1.76B1.84B1.88B1.79B1.76B1.68B1.77B1.90B1.91B
4중국10.57%1.65B1.65B1.65B1.76B1.80B1.83B1.82B1.82B1.84B1.86B1.88B1.93B1.89B1.90B1.91B
5에티오피아10.48%800.00M850.00M900.00M900.00M1.23B1.46B1.27B1.23B1.51B1.59B1.45B2.33B1.43B1.55B1.89B
6가나9.5%1.50B1.35B1.30B1.27B1.26B1.30B1.30B1.30B1.39B1.46B1.52B1.60B1.65B1.70B1.71B
7파푸아뉴기니1.54%265.00M265.00M275.00M250.00M270.00M276.32M271.57M270.80M270.63M270.91M271.65M276.65M275.66M276.35M277.05M
8마다가스카르1.27%236.58M235.44M232.10M232.00M234.00M233.54M233.52M233.61M233.78M233.95M234.10M231.25M230.74M230.25M229.76M
9르완다1.06%136.85M185.96M187.25M130.51M93.39M66.88M82.24M166.19M215.02M167.98M171.80M188.04M200.86M202.89M191.92M
10이집트0.99%114.28M119.38M103.12M118.76M116.58M122.83M102.56M86.67M109.15M120.64M122.00M133.45M156.73M177.73M178.05M

Shares of Top 10 Producers

Discover the production share of top 토란 producing countries in 2023.
나이지리아 held the largest share of 토란 production quantity at 46.22%. Its production quantity increased by 1.64% between 2022 and 2023, reaching 8.33B.
Note: Share percentages are calculated based on countries with reported production data and may not include those without available records.
Rank
Country
Share in Production
2023
Production Quantity
2023
1-Year Growth in Qty
2022-2023
3-Year Growth in Qty
2020-2023
5-Year Growth in Qty
2018-2023
Who we are

Intelligence that moves markets. Connections that power trade.

From AI-powered intelligence to a global trade network, we help you make smarter decisions, optimize costs, and connect with the right partners—faster and easier.
By clicking “Accept Cookies,” I agree to provide cookies for statistical and personalized preference purposes. To learn more about our cookies, please read our Privacy Policy.