Global trading platform Tridge
Services
Resources
Company
Everything you love about a trade show, made 24/7
Sponsored by
image
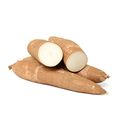
Cassava

Cassava

HS Code: 071410 - Vegetable roots and tubers; manioc (cassava), with high starch or inulin content, fresh, chilled, frozen or dried, whether or not sliced or in the form of pellets
FAO Code: 0125 - Cassava
Follow and receive newsletters related to the following product.
HS Code: 071410 - Vegetable roots and tubers; manioc (cassava), with high starch or inulin content, fresh, chilled, frozen or dried, whether or not sliced or in the form of pellets
|
FAO Code: 0125 - Cassava
Top Exporter
2021
VN flagVietnam
Top Importer
2021
CN flagChina
Top Producer
2020
NG flagNigeria
Export Value
2021
361.24MUSD
1Y -73.45%
Import Value
2021
361.60MUSD
1Y -77.24%
Production Volume
2020
296.22MMTs
1Y +1.05%

Production of Cassava

Discover production data of Cassava. Get production volume, price data, trends, and more. The information below is based on the FAO code 0125 (Cassava).

Production Trends Overview of Top 10 Countries

See the production trends of the top 10 countries that have the highest production volumes.
NG flagNigeria
Rank 1
60.0M Metric Ton
1y
+0.99%
3y
+8.96%
5y
+4.09%
CD flagDemocratic Republic of the Congo
Rank 2
41.0M Metric Ton
1y
+2.41%
3y
+8.79%
5y
+17.42%
TH flagThailand
Rank 3
29.0M Metric Ton
1y
-6.70%
3y
-4.91%
5y
-10.38%
GH flagGhana
Rank 4
21.8M Metric Ton
1y
+12.62%
3y
+14.75%
5y
+26.72%
ID flagIndonesia
Rank 5
18.3M Metric Ton
1y
+11.94%
3y
-3.95%
5y
-16.05%
BR flagBrazil
Rank 6
18.2M Metric Ton
1y
+3.48%
3y
-1.60%
5y
-21.05%
VN flagVietnam
Rank 7
10.5M Metric Ton
1y
+3.08%
3y
+2.14%
5y
-2.35%
AO flagAngola
Rank 8
8.8M Metric Ton
1y
-2.43%
3y
+5.47%
5y
+13.65%
KH flagCambodia
Rank 9
7.7M Metric Ton
1y
+2.18%
3y
+2.18%
5y
+2.18%
TZ flagTanzania
Rank 10
7.5M Metric Ton
1y
-7.75%
3y
+87.56%
5y
+28.26%

Production Data Summary

View latest production volumes of Cassava by using the standard FAO codes from the Food and Agriculture Organization of the United Nations.

Trends of Top 10 Producers

This is the production trends of the top 10 producers of Cassava from 2006 to 2020.
CountryProduction %Production Volume
200620072008200920102011201220132014201520162017201820192020
1Global221.32M224.58M227.50M231.50M249.17M262.85M271.40M275.98M282.63M282.10M281.77M275.15M285.01M293.15M296.22M
2Nigeria20.26%45.72M43.41M44.58M36.82M42.53M46.19M50.95M47.41M56.33M57.64M59.57M55.07M55.87M59.41M60.00M
3Democratic Republic of the Congo13.85%14.99M15.00M15.01M15.05M31.27M32.54M33.03M33.92M34.87M34.93M35.50M37.70M38.87M40.05M41.01M
4Thailand9.79%22.58M26.92M25.16M30.09M22.01M21.91M29.85M30.23M30.02M32.36M31.16M30.50M29.37M31.08M29.00M
5Ghana7.36%9.64M10.22M11.35M12.23M13.50M14.24M14.55M15.99M17.80M17.21M17.80M19.01M20.85M19.37M21.81M
6Indonesia6.18%19.99M19.99M21.59M22.04M23.92M24.04M24.18M23.94M23.44M21.80M20.26M19.05M16.12M16.35M18.30M
7Brazil6.15%26.64M26.54M26.70M24.40M24.97M25.35M23.04M21.48M23.25M23.06M21.04M18.50M17.88M17.59M18.21M
8Vietnam3.54%7.78M8.19M9.31M8.53M8.60M9.90M9.74M9.76M10.21M10.74M10.91M10.27M9.85M10.17M10.49M
9Angola2.96%9.04M9.73M10.06M12.83M13.86M14.33M10.64M16.41M7.64M7.73M7.92M8.33M8.73M9.00M8.78M
10Cambodia2.59%2.18M2.22M3.68M3.50M4.25M8.03M7.61M7.55M7.50M7.50M7.50M7.50M7.50M7.50M7.66M

Shares of Top 10 Producers

These are shares of top 10 producers of Cassava in 2020.
Rank
Country
Country
2020
Production Quantity
2020
1-Year Growth in Qty
2019-2020
3-Year Growth in Qty
2017-2020
5-Year Growth in Qty
2015-2020

Explore More Through Our Services

Our Solution

Intelligence & Data

Get access to the most extensive intelligence of food and agricultural products around the globe to help you make smarter business decisions.
Our Solution

Fulfillment Solution

Source food and agricultural products efficiently from over 70 countries. We take care of everything from production to shipment for you.
Our Solution

Sourcing Hub

Connect and engage with thousands of credible agri-food suppliers worldwide. Find the right suppliers for your business or have the right suppliers find you.
Who We Are

The leading global sourcing hub of food & agriculture

We provide solutions to help you not only understand the global market of food and agriculture, but also start importing products that you need right away.
By clicking “Accept Cookies,” I agree to provide cookies for statistical and personalized preference purposes. To learn more about our cookies, please read our Privacy Policy.