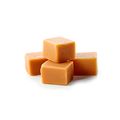
Milk Caramel
HS Code: 170490 - Sugar confectionery; (excluding chewing gum, including white chocolate), not containing cocoa
|
FAO Code: 1130 - Raw milk of camelMarket:
Share in Production
2023
7.16%Rank 4
Production Volume
2023
293.33MKG
1Y +2.00%
Production of Milk Caramel in Mali
Discover production data of Milk Caramel in Mali. Get production volume, price data, trends, and more. The information below is based on the FAO code 1130 (Raw milk of camel).
Production Trends
This is the production trends of Milk Caramel in Mali from 2009 to 2023 in volume.
293.3M kg
1y
+2.00%
3y
+8.24%
5y
+10.41%
Related Countries
Related exporters and importers
Related Information
People who viewed Milk Caramel also viewed
Other products in Snack & Confectionary
Other products in Snack & Confectionary
By clicking “Accept Cookies,” I agree to provide cookies for statistical and personalized preference purposes. To learn more about our cookies, please read our Privacy Policy.