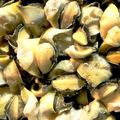
Frozen Snail
HS Code: 030760 - Molluscs; snails, other than sea snails, whether in shell or not, live, fresh, chilled, frozen, dried, salted, in brine, or smoked, cooked or not before or during the smoking process
|
FAO Code: 1176 - Snails, fresh, chilled, frozen, dried, salted or in brine, except sea snailsMarket:
Top Exporter
2023

Top Importer
2023

Top Producer
2023
Export Value
2023
64.10MUSD
1Y +13.94%
Import Value
2023
71.05MUSD
1Y +15.12%
Production Volume
2023
19.86MKG
1Y +1.82%
Production of Frozen Snail
Discover production data of Frozen Snail. Get production volume, price data, trends, and more. The information below is based on the FAO code 1176 (Snails, fresh, chilled, frozen, dried, salted or in brine, except sea snails).
Production Trends Overview of Top 10 Countries
In 2023, Morocco was the largest producer of Frozen Snail, followed by Tunisia, Turkiye, Ivory Coast. This ranking is based on available production data and may exclude countries with missing records.
Rank 1
18.0M kg
1y
+1.95%
3y
+6.69%
5y
+7.24%

Rank 2
1.0M kg
1y
+0.26%
3y
+1.28%
5y
+1.69%

Rank 3
532.7K kg
1y
-0.25%
3y
-1.38%
5y
-3.13%

Rank 4
318.0K kg
1y
+3.17%
3y
+8.45%
5y
+11.20%
Trends of Top 10 Producers
This is the production trends of the top 10 producers of Frozen Snail from 2009 to 2023.
Shares of Top 10 Producers
Discover the production share of top Frozen Snail producing countries in 2023.
Morocco held the largest share of Frozen Snail production quantity at 90.61%. Its production quantity increased by 1.95% between 2022 and 2023, reaching 17.99M.
Note: Share percentages are calculated based on countries with reported production data and may not include those without available records.
Related Countries
Related exporters and importers
Related Information
People who viewed Frozen Snail also viewed
Other products in Seafood
Other products in Other Seafood
By clicking “Accept Cookies,” I agree to provide cookies for statistical and personalized preference purposes. To learn more about our cookies, please read our Privacy Policy.