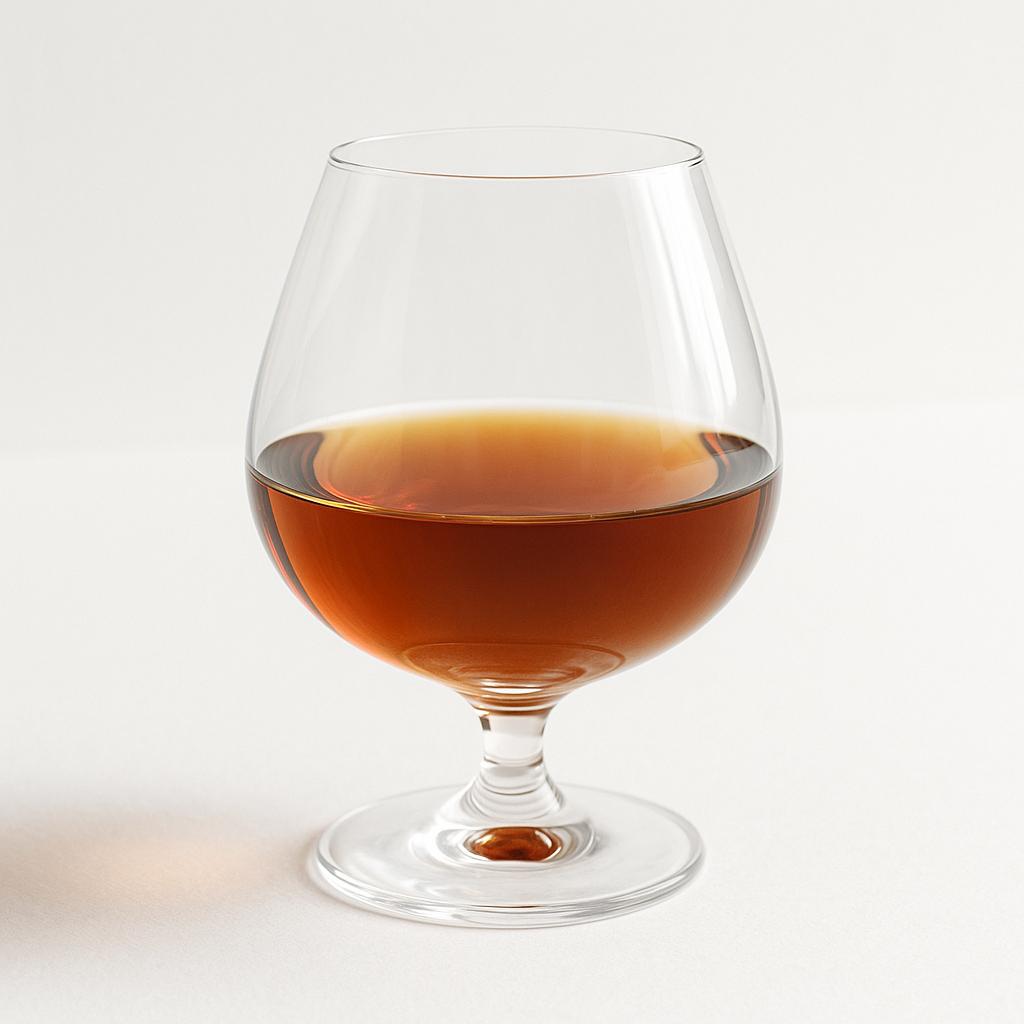
Brandy Prices & Trade in Togo — Market Overview 2026
Sub Product
Apple Brandy, Apricot Flavored Brandy, Armagnac Brandy, Blackberry Flavored Brandy, +5
Derived Products
Sauce Americaine, Rich Fruit Cake, Fortified Wine
Raw Materials
Fresh Grape
HS Code
220820
Last Updated
2026-11-06
Key takeaways for search and sourcing teams
- 5 export partner countries and 5 import partner countries are ranked.
- Latest reference year in this page dataset is 2024.
- Page data last updated on 2026-11-06.
Brandy Export Supplier & Manufacturer Intelligence, Price Trends, and Trade Flows in Togo
Use Supply Chain Intelligence company profiles and analytics to validate Brandy exporter coverage, partner quality, and route priorities in Togo.
Annual Export Value, Volume, and Supplier Market Size for Brandy in Togo (HS Code 220820)
Analyze 1 years of Brandy export volume and value in Togo to evaluate supplier market growth, seasonality, and trade volatility.
| Year | Volume | Value |
|---|---|---|
| 2024 | 2,199,809 | 2,025,276 USD |
Top Destination Markets for Brandy Exports from Togo (HS Code 220820) in 2024
For 2024, compare export volume and value across the top 5 destination countries for Brandy exports from Togo.
| Rank | Country | Volume | Value |
|---|---|---|---|
| 1 | Ghana | 722,544 | 910,840.292 USD |
| 2 | Republic of the Congo | 909,193 | 333,135.843 USD |
| 3 | Burkina Faso | 230,480 | 312,032.424 USD |
| 4 | Belgium | 24,254 | 249,480.077 USD |
| 5 | Senegal | 51,066 | 75,366.056 USD |
Tridge Ark · Sourcing Feasibility Check
Could you be importing Brandy from Togo yourself?
Just tell us your spec and the volume you need. We'll check whether it's actually sourceable, and which origins and suppliers fit.
Free feasibility check, no account required.
Brandy Import Buyer Intelligence and Price Signals in Togo: Buyers, Demand, and Trade Partners
Exporters and importers can use Supply Chain Intelligence company profiles and analytics to analyze Brandy buyer demand, partner density, and downstream channels in Togo.
Scatter points are sampled from 100.0% of the full transaction dataset. Each point is a real transaction — click one to see its details and ask AI Chat whether it was a fair deal.
Sample Import Transaction and Price Records for Brandy in Togo
4 sampled Brandy import transactions in Togo provide date, origin, and trade-country context to benchmark price levels and demand-side trading patterns.
Brandy sampled import transaction unit prices by date in Togo: 2026-04-29: 2.79 USD / kg, 2026-04-29: 2.79 USD / kg, 2026-04-17: 1.30 USD / kg, 2026-04-17: 1.30 USD / kg.
| Date | Reported Product | Unit Price | Exporter | Importer | Origin | |
|---|---|---|---|---|---|---|
| 2026-04-29 | MOR***** **** ******* ****** **** ** * ** * *** ** ******* *** ***** ********* ******** *** | 2.79 USD / kg | (-) | (-) | - | |
| 2026-04-29 | MOR***** **** ******* ****** **** ** * ** * *** ** ******* *** ***** ********* ******** *** | 2.79 USD / kg | (-) | (-) | - | |
| 2026-04-17 | RAD*** *** ******* **** ****** *** * ***** ******* *** ***** ********* ******* *** | 1.30 USD / kg | (-) | (-) | - | |
| 2026-04-17 | RAD*** *** ******* **** ****** *** * ***** ******* *** ***** ********* ******* *** | 1.30 USD / kg | (-) | (-) | - |
See These Togo Brandy Shipments — and at What Price
Free account — open the full market in Tridge Eye
Sign up and verify your company — newly verified companies can try Tridge Eye Business free.
Annual Import Value, Volume, and Demand Size for Brandy in Togo (HS Code 220820)
Track 1 years of Brandy import volume and value in Togo to assess demand growth and market momentum.
| Year | Volume | Value |
|---|---|---|
| 2024 | 8,143,833 | 3,623,523 USD |
Top Origin Supplier Countries Supplying Brandy to Togo (HS Code 220820) in 2024
For 2024, compare import volume and value across the top 5 origin supplier countries supplying Brandy to Togo.
| Rank | Country | Volume | Value |
|---|---|---|---|
| 1 | France | 1,689,306 | 1,505,165.563 USD |
| 2 | Poland | 5,510,966 | 764,786.393 USD |
| 3 | Netherlands | 36,382 | 741,477.212 USD |
| 4 | United Kingdom | 129,718 | 328,125.772 USD |
| 5 | India | 682,288 | 251,732.521 USD |
Tridge Ark · Export Feasibility Check
Your Brandy — could it sell to these buyers in Togo?
Just tell us what you make. We'll see whether you're ready to export today and which markets suit your offer.
Free feasibility check, no account required.
Other Brandy Country Markets for Supplier, Manufacturer, Export, and Price Comparison from Togo
Compare Brandy supplier coverage, trade flows, and price benchmarks across countries related to Togo.


Tridge Ark · Export & Sourcing Feasibility Checks
Brandy in Togo — are you buying, or selling?
Either way it's a few questions. We'll come back with where you could buy it, or who you could sell it to.
Free feasibility check, no account required.
Related Brandy Product Categories
Browse parent, sub, derived, and raw-material product market pages related to Brandy.
Raw materials: Fresh Grape
By clicking “Accept Cookies,” I agree to provide cookies for statistical and personalized preference purposes. To learn more about our cookies, please read our Privacy Policy.