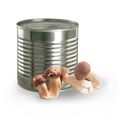
Value Added Porcini Mushroom
HS Code: 200390 - Vegetable preparations; mushrooms and truffles, other than mushrooms of the genus Agaricus, prepared or preserved otherwise than by vinegar or acetic acid
Market:
Top Exporter
2023

Top Importer
2023

Export Value
2023
1.20BUSD
1Y -14.84%
Import Value
2023
449.73MUSD
1Y +5.24%
Import of Value Added Porcini Mushroom
Discover import data of Value Added Porcini Mushroom. Get import value, price data, trends, and more. The information below is based on the HS code200390 (Vegetable preparations; mushrooms and truffles, other than mushrooms of the genus Agaricus, prepared or preserved otherwise than by vinegar or acetic acid).
Related Market Brief Curations
Discover curated market data on import for Value Added Porcini Mushroom.


Import Trends Overview of Top 10 Importing Countries in 2023
In 2023, Hong Kong was the top importing country of Value Added Porcini Mushroom, followed by Japan, Germany, United States, France, South Korea, United Kingdom, Spain, Portugal, Switzerland. This ranking is based on available import data and may not include countries with missing records.
Rank 1
$219.1M
1y
+23.09%
3y
+591.33%
5y
+1675.60%

Rank 2
$46.3M
1y
-1.07%
3y
+6.95%
5y
+8.28%

Rank 3
$24.1M
1y
+4.76%
3y
+63.92%
5y
+74.01%

Rank 4
$22.0M
1y
-21.82%
3y
+33.44%
5y
+58.08%

Rank 5
$18.9M
1y
-3.70%
3y
+100.33%
5y
+46.13%
Rank 6
$12.1M
1y
+1.73%
3y
+15.31%
5y
+20.45%

Rank 7
$7.4M
1y
-1.57%
3y
+73.90%
5y
+59.29%

Rank 8
$7.1M
1y
+80.55%
3y
+108.88%
5y
+83.98%

Rank 9
$6.4M
1y
+2.25%
3y
+81.90%
5y
+45.44%

Rank 10
$6.3M
1y
-3.25%
3y
+14.23%
5y
+30.40%
Notable import transactions in 2024
View notable import transactions of Value Added Porcini Mushroom globally.
Unlock complete import data for Value Added Porcini Mushroom
Gain full access to detailed import prices, top importers, and market insights to make data-driven decisions.
Trends of Top 10 Importers
This is the import trends of the top 10 importers of Value Added Porcini Mushroom from 2017 to 2023.
Top Import Flows
Discover the top import flows of Value Added Porcini Mushroom in 2023. The top import flow in 2023 was from Hong Kong to China, with an import value of USD 217.97M.
Share of Top Importing Countries
Discover the import share of top Value Added Porcini Mushroom importing countries in 2023.
Hong Kong held the largest share of Value Added Porcini Mushroom import value at 48.72%. Its import value increased by 23.09% between 2022 and 2023, reaching 219.10M.
Note: Share percentages are calculated based on countries with reported import data and may not include those without available records.
Related Countries
Related exporters and importers
Related Information
People who viewed Value Added Porcini Mushroom also viewed
Other products in Packaged Fruits & Vegetables
By clicking “Accept Cookies,” I agree to provide cookies for statistical and personalized preference purposes. To learn more about our cookies, please read our Privacy Policy.