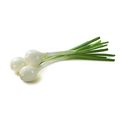
Fresh Scallion (Spring Onion)
HS Code: 070390 - Vegetables, alliaceous; leeks and other kinds n.e.c. in heading no. 0703, fresh or chilled
|
FAO Code: 0402 - Onions and shallots, greenMarket:
Top Exporter
2023

Top Importer
2023

Top Producer
2023

Export Value
2023
359.47MUSD
1Y +28.23%
Import Value
2023
477.06MUSD
1Y +18.76%
Production Volume
2023
6.75BKG
1Y +0.97%
Production of Fresh Scallion (Spring Onion)
Discover production data of Fresh Scallion (Spring Onion). Get production volume, price data, trends, and more. The information below is based on the FAO code 0402 (Onions and shallots, green).
Related Market Brief Curations
Discover curated market data on production for Fresh Scallion (Spring Onion).

Production Trends Overview of Top 10 Countries
In 2023, China was the largest producer of Fresh Scallion (Spring Onion), followed by Mali, Angola, Japan, South Korea, Tunisia, Nigeria, New Zealand, Thailand, Turkiye. This ranking is based on available production data and may exclude countries with missing records.
Rank 1
872.2M kg
1y
-0.20%
3y
+0.25%
5y
+0.43%

Rank 2
795.6M kg
1y
+30.31%
3y
+14.30%
5y
+18.20%

Rank 3
575.6M kg
1y
+3.06%
3y
-5.02%
5y
-0.57%

Rank 4
504.7M kg
1y
+1.59%
3y
+1.33%
5y
-1.31%

Rank 5
438.8M kg
1y
-2.20%
3y
+5.00%
5y
-10.43%

Rank 6
281.1M kg
1y
+0.42%
3y
-1.56%
5y
+3.55%

Rank 7
244.1M kg
1y
-0.32%
3y
+0.12%
5y
+4.44%

Rank 8
220.8M kg
1y
+0.33%
3y
-12.08%
5y
-14.67%

Rank 9
177.6M kg
1y
+3.70%
3y
+0.17%
5y
-12.74%

Rank 10
115.7M kg
1y
-7.16%
3y
-10.32%
5y
-19.01%
Trends of Top 10 Producers
This is the production trends of the top 10 producers of Fresh Scallion (Spring Onion) from 2009 to 2023.
Shares of Top 10 Producers
Discover the production share of top Fresh Scallion (Spring Onion) producing countries in 2023.
China held the largest share of Fresh Scallion (Spring Onion) production quantity at 17.52%. Its production quantity decreased by -0.20% between 2022 and 2023, reaching 872.23M.
Note: Share percentages are calculated based on countries with reported production data and may not include those without available records.
Related Countries
Related exporters and importers
Related Information
People who viewed Fresh Scallion (Spring Onion) also viewed
Other products in Vegetables
By clicking “Accept Cookies,” I agree to provide cookies for statistical and personalized preference purposes. To learn more about our cookies, please read our Privacy Policy.